




What Is the Three White Soldiers Pattern?
The three white soldiers pattern is a powerful bullish reversal signal and is a very well-known pattern by technical analysts. For the trader that knows how to read this pattern properly, it can mark the beginning of a substantial upward trend.
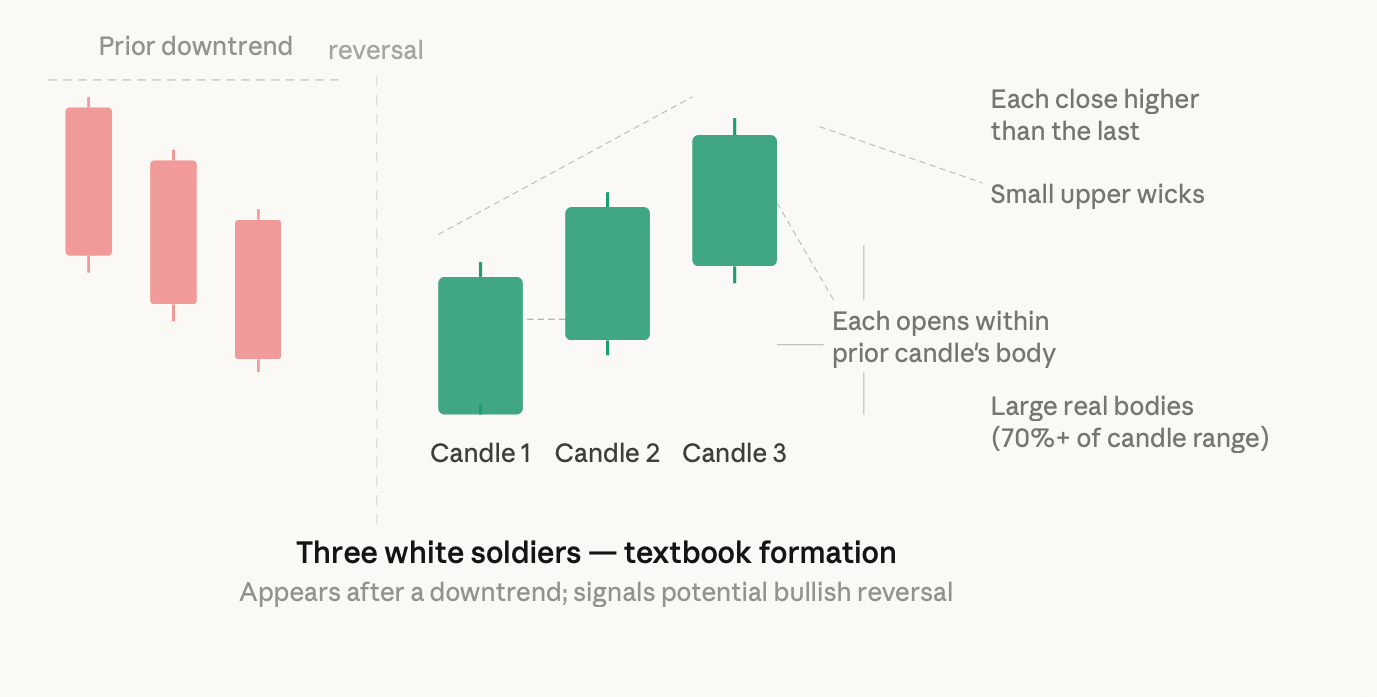
In its simplest form, the three white soldiers candlestick pattern consists of three consecutive bullish candlesticks, each closing higher than the last, forming a staircase-like pattern after a prolonged downtrend. The name of this pattern describes it visually: three candles marching up like soldiers in formation.
This pattern is applicable to a variety of markets, including forex with pairs like EUR/USD and GBP/JPY, commodity CFDs such as gold and crude oil, major stock indices, and increasingly to the nascent crypto markets in which price movement is typically very volatile and trend-driven.
Traders find the three white soldiers candlestick pattern appealing because it does not reflect only price movement; it also shows where the balance of power between buyers and sellers has shifted and thus has a much greater meaning than any single candlestick.
One of the most important points to understand about this pattern is that it is only valid when it occurs at the end of a downtrend or after a significant price decline. In other words, if you see this pattern appear three times consecutively in the middle of a sideways market, it means very little about future price direction. Context is critical to the three white soldiers pattern setup.
How to Identify a Valid Three White Soldiers Pattern
Identifying a type of chart is one aspect of trading; however, identifying an actual tradeable type of chart is a very different animal altogether. Countless traders have entered trades or have already established positions based on a poor looking pattern that looked good from a distance; however, upon closer examination, they didn't have the appropriate structural elements that give the pattern its strength.
A qualified three white soldiers pattern meets three non-negotiable structural criteria. The first criterion is that all three candles must be white, meaning that they closed higher than where they opened.
The second criterion is that each successive candle must have a higher close than the previous close, establishing a staircase effect of closing price increases. The third criterion is that each candle must open within the body of the preceding candle rather than open above it by an arbitrary amount; thereby providing for a consistent, incremental increase in price progression, rather than a large jump in price that could be indicative of a significant decrease in price soon thereafter.
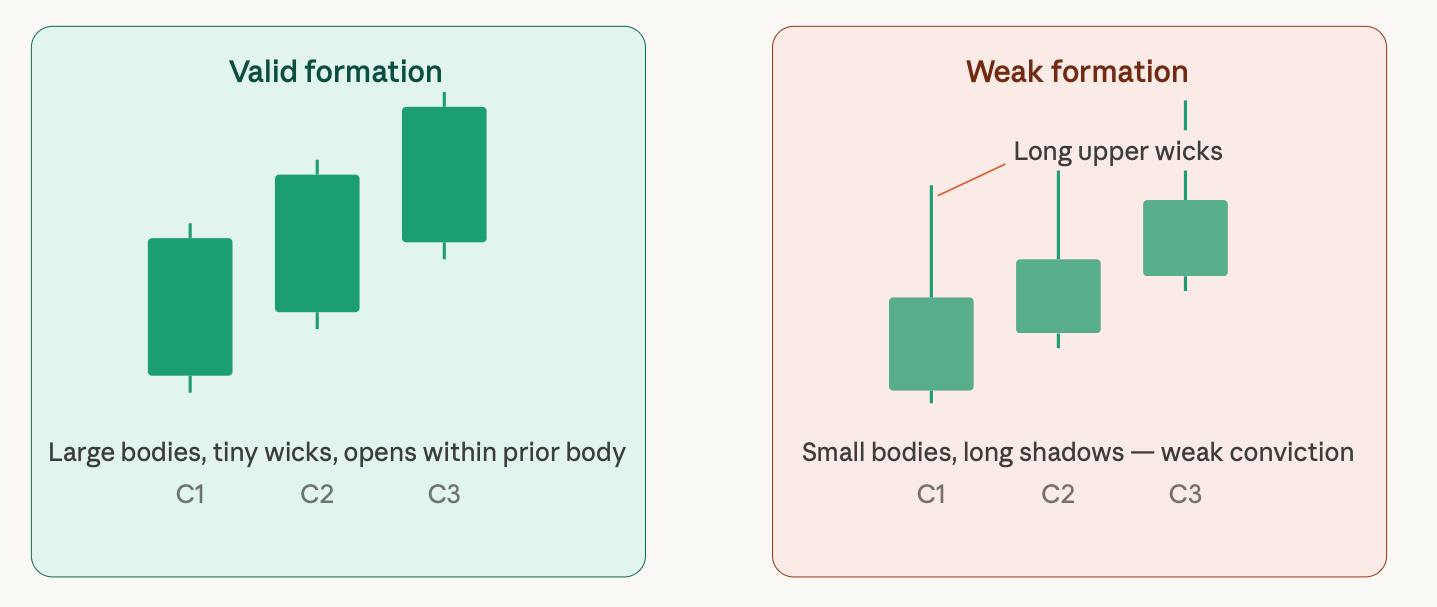
Beyond structural criteria, the quality of the individual candles in a three white soldiers setup is as important as the sequence of the candles. High-quality candles will have large real bodies that represent 70% of the wick to wick candle range. Ideal candles will have either no or very small upper wicks.
Very long upper wicks indicate that buyers attempted to raise prices but were unable to do so; this decreases the amount of bullish conviction that the pattern is intended to convey.
Unfortunately, the number of weak variations of the three white soldiers pattern far exceeds textbook instances, and as a result, traders are continuously blindsided when trading these patterns.
A three white soldiers pattern where all of the candles that have been previously referenced in this paragraph have long upper wicks indicates that buyers have encountered significant resistance at the price highs.
Candles that have small bodies relative to their total range are also reflective of indecision rather than conviction. Finally, any version of the three white soldiers pattern that occurs in the middle of a trendless, consolidating market will possess no predictive ability whatsoever.
The Psychology Behind Three White Soldiers
Examining the underlying reasons that cause this pattern to work requires an analysis of the buyer and seller behaviors between the three sessions as seen on the price action. When looking at the price movement on a candle-by-candle basis, it becomes apparent that the market control is being gradually transferred.
The very first candle occurs at the end of a downward move and is the least definitive candle of the three. Short sellers have made profits throughout the downward movement and are now experiencing indecisiveness. Some of these short sellers begin to take their profits.
By taking their profits, they remove some of the selling pressure from the market and permit prices to rise. Buyers are still taking a wait-and-see approach but created some doubt in the minds of the bears and the price closed above the open.
As a result, the second candle's risk is much greater than the first. The first candle encourages buyers to purchase with confidence. Buyers convert their undecided positions to long and create new long positions. The second candle opened within the range of the first candle and did not gap from it. Thus, the buying pressure is building at a constant pace, not through a blowout or by purchasing sustainably.
By the third candle, the position of the short seller is under considerable psychological pressure to exit the market. Each increase in price places more pressure on the short sellers to cover their position, or what traders refer to as short-covering.
As the short sellers exit the market, their buying adds to the purchasing side of the order book. In addition, you may find that this buying is being accelerated by institutional accumulation, in which larger, more powerful participants in the market are holding positions to capitalize on a measure, multi-day rise.
As a useful analogy for this trading pattern, consider a team that is positioned to lose the game, scores three consecutive goals and an immediate shift in momentum occurs, toughens up the other team's, and motivates the leading team due to crowd support. The crowd represents retail traders moving in, causing the price to rise decisively through the continued volume of buying.
Gold is the classic example of the three white soldiers' pattern, immediately following an expected rate-cut pivot. When the macro view changes from a tighter monetary policy toward an anticipated ease of monetary policy, gold frequently participates as demonstrated by the aforementioned pattern over the three sessions, initially by institutional investors followed by bulk market participants.
How Reliable Is the Three White Soldiers Pattern? Backtesting and Win Rates
Most traders want to learn if the patterns that they utilize will generate profits, but unfortunately the answer is not always clear. Using data from backtesting massive amounts of trades in many different types of instruments and timeframes has shown that the 3 white soldiers pattern is statistically advantageous, however the degree of that advantage relies heavily on the way it is implemented.
The backtesting that has been done on both forex major currencies and stock indexes has shown that the 3 white soldiers pattern has a successful trade rate of between 55 percent to 65 percent, therefore meeting the minimum threshold of 55% profitability in any type of trading. So the longer number of trades you make, the higher the expected profit will become.
The daily format of trading has proven to yield better results than any type of intraday trading and if you were to use the same time period using 4 hour or 1 hour charts would give you more 3 white soldier signals generated, however they also have a much higher rate of failure because at the shorter timeframes you will have much more volatility than on the larger timeframes. Therefore the pattern's volume can help support the location of the pattern on larger timeframes.
By performing an expectancy calculation we can get an idea how much the statistical advantage is. If a trader follows the rules of the 3 white soldiers and implements it into a 100 trade system using a 60% or 0.6% win / loss ratio we can see that there would be 60 winning trades at 2 points = 120 and 40 losing at 1 = 40 resulting in a return of 80 points for a successful expectancy of 0.8 point per trade, which is a significant expected return and would lose the trader money based upon use of the 3 white soldiers without properly placing their position sizes or applying a stop loss.
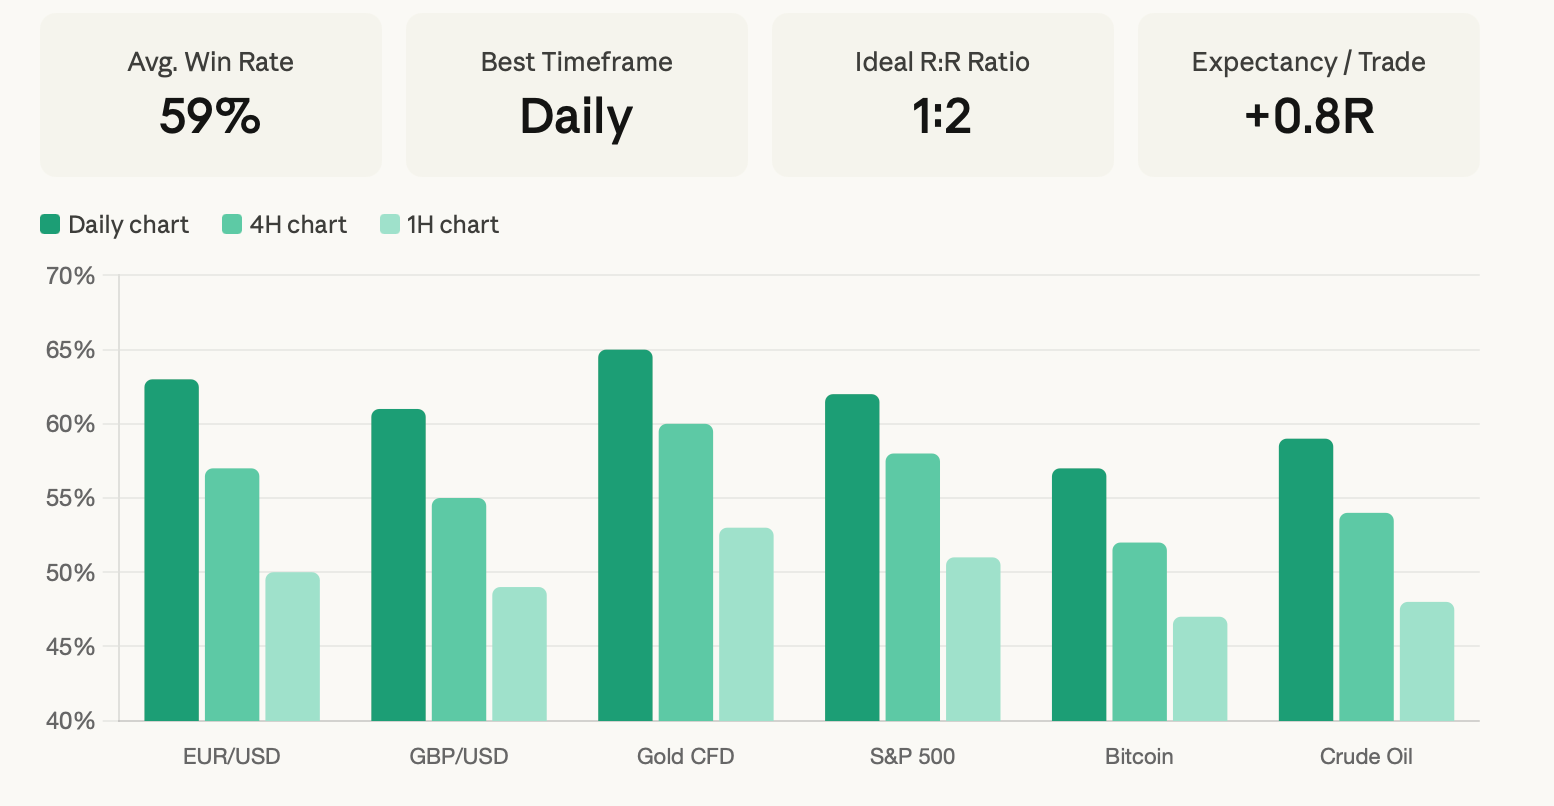
There is solid evidence that daily setup trading stocks can be more productive than intraday setups because of the increased order volume from institutions in the gold and foreign exchange markets. The signals generated by these trades will usually support secure profit margins with less volatility than trades made on shorter time frames such as 4-hour charts.
Therefore, although daily and 4-hour time frame setups offer similar win rate advantages, the total number of successful trades that can occur on daily series of periods will out number the total number of successful trades that occur on all other shorter lengths combined.
How to Trade the Three White Soldiers Pattern
Once you have identified the pattern; the next step is to structure the trade around it. This is where you will see the difference between those that profit from this pattern setup and those that give those profits back.
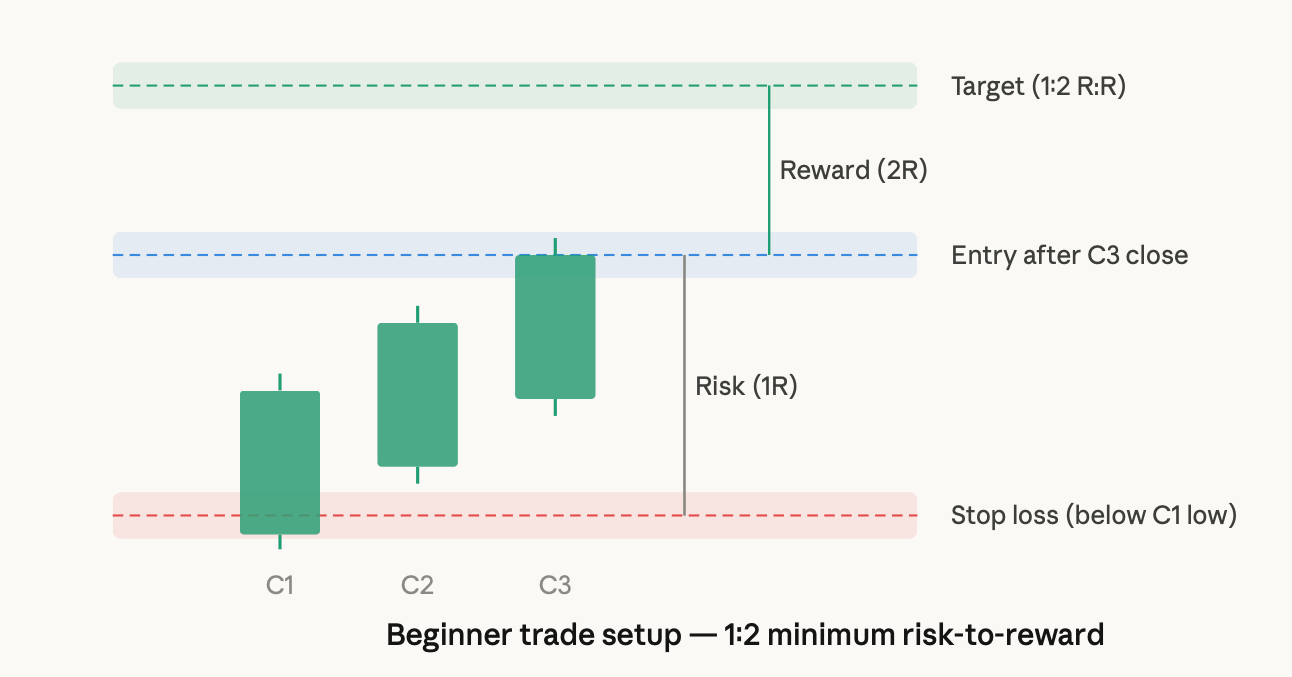
Beginner Setup: The easy way is to enter a long position after the 3rd candle closes if all 3 structural rules have been fulfilled. The stop loss will go below the low of the first candle in the sequence; this is where your bullish thesis has been objectively invalidated. The minimum profit target should be set at 2 times the risk distance away from your entry (1:2 R/R), although there are instances where 1:3 setups become available when momentum is strong in a trending market.
Advanced Setup: More experienced traders tend to want to see at least 1 pullback candle after the 3rd white soldier closed, this allows them to reduce their entry price point; widen their profit potential; and gives them a natural location for their stop below the low of the pullback candle. When they can also use another nearby level of support to reinforce their trade, they increase the overall quality of the trade via confluence with their bullish case.
This is improved upon when they also seek confirmation from the RSI, they would look for it to be rising above level 50 without being heavily overbought as a means to help filter out trades where the market may already be exhausted from the run.
The last and usually overlooked aspect of position sizing is that they are the final element of trade. 1% to 2% of total capital at risk per trade in the event of consecutive losses will result in no permanent damage to the account; however, the long-term impact on the account will be compounded by a series of successful trades.
Why Your Three White Soldiers Trade Failed: 5 Common Traps
Even if you do everything right and identify the pattern correctly, most of the time it will fail because of things separate from the pattern itself, like how the market was acting prior to the pattern and how you executed it.
1. Sideways Markets: A 3-bullish candle pattern in a sideways market has no directional bias. If there was no clear downtrend prior to the bullish pattern, then the pattern is not structurally valid.
2. Missing Volume Confirmation: In Equity and Futures markets, if there are 3-white soldier patterns forming with below average volume on each day, this is an extreme warning sign to traders. It means that there is not enough volume to confirm that the bullish pattern has strong conviction through participation.
3. Resistance Levels: If price is able to create a 3-white soldier's pattern near a major resistance level, the bullish signal will be immediately decreased as there is a selling pressure above this price level.
4. Ignoring Significant Macro Economic Event Risk: A textbook 3-white soldiers pattern that is created on the day prior to a Federal Reserve rate decision, Non-Farm Payrolls monthly report, or CPI report has an extreme amount of event risk. These events can invalidate every technical pattern within a matter of seconds.
5. Incorrect Stop-Loss Execution: This is the most frequently made and most expensive trading mistake. When traders move their stop-loss, do not have a stop loss at all, or simply do not accept losses when price reaches their stop-loss did not allow for a relatively small loss to become a catastrophic loss.
Professional Insight: Discipline is the multiplier that can turn an average pattern into a consistent edge. The pattern will not be profitable. Your willingness to take a loss on the 40% of trades that are not successful will create the room for the 60% currently profitable trades to continue to run.
Three White Soldiers vs Three Black Crows
The isolated understanding of the three white soldiers pattern is beneficial, but the correlation of the three black crows pattern gives traders an expanded toolset to find significant turning points in both directions.
The three black crows is the reverse image of the three white soldiers; three consecutive bearish candle sticks, each open inside of the previous candlestick's body and closed lower than the previous close. The three white soldiers indicates a potential floor, while the three black crows indicates a likely ceiling. The rules of structure are structurally identical, but the direction is inversed.
In terms of psychological narrative, the three black crows represents a loss of buyer confidence over three sessions, a gain of seller control over order flow, and the liquidation of long positions as the market begins to agree that there is no more fuel for the uptrend.
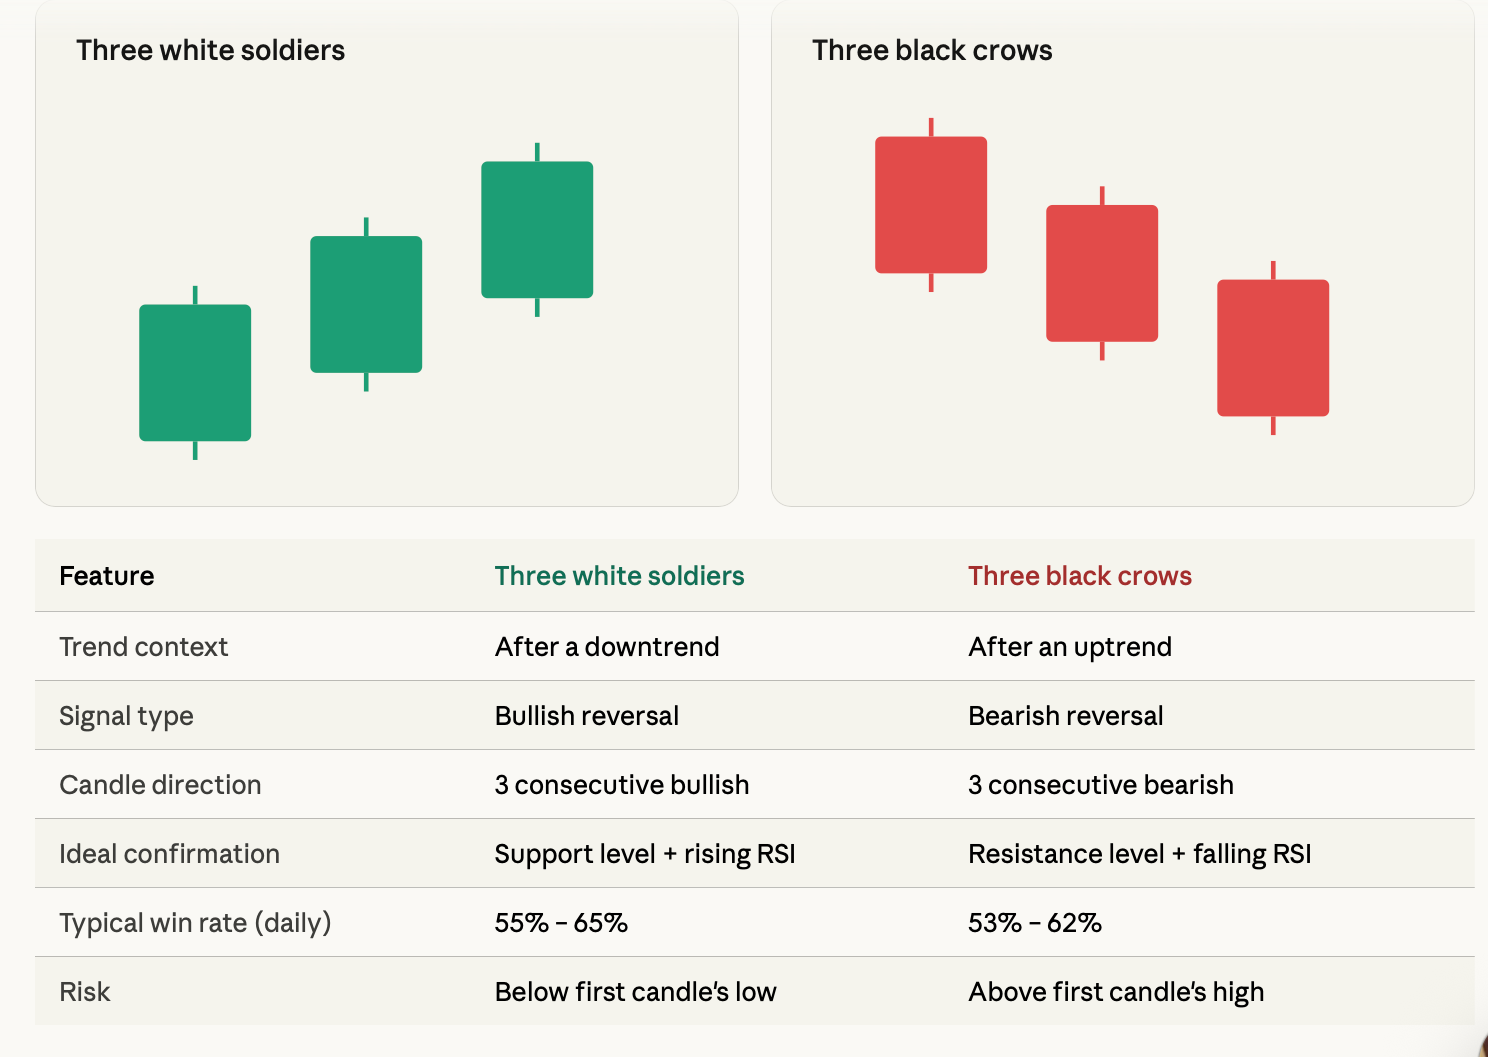
The primary concept relevant to the two varieties is that meaning develops from location. A formation of three black crows following an extended rally after numerous weeks of price increases has significantly greater bearish significance than if this same figure appeared at an earlier support level where significant selling had been experienced.
From Pattern to System: Building a Professional Trading Plan
Traders who consistently profit from the three white soldiers pattern do not consider this an independent signal. Rather, they view it as part of a bigger, rule-based system, which is important enough for this distinction to be made.
Traders begin their functional systems with a trend filter. Before seeking three white soldiers setups, traders need to confirm that the higher timeframe trend is in either a bearish back to bearish, or transitioning upwards. The 50 and 200-period moving averages are typically used to provide the context for this confirmation on daily charts.
Traders will further confirm with an additional support/resistance level to find the strongest setups. Traders want to find the three white soldiers to occur at or near a clearly defined support level. This level will create independent technical evidence that excessive selling pressure has taken place at that price.
The traders will use RSI divergences as added support for their trades. When price makes a lower low during the previous downtrend and the RSI makes a higher low during the same time, this indicates that the momentum for selling is deteriorating at the same time price declines.
Multi-timeframe alignment is used as an additional means of confirming prior price action. A three white soldiers pattern on a daily chart will be substantially validated when there is a breakout of a recent range high on the 4 hour. This information indicates confirmed buyer activity is occurring on multiple timeframes at the same time.
How to Practice on BTCdana
The most valuable thing a trader can do before committing real capital to any pattern-based strategy is to practice on a demo account, where all the market conditions are real but the financial consequences of mistakes are not.
On the BTCdana platform, you can access live candlestick charts across forex pairs, crypto assets, and commodity CFDs, where the three white soldiers pattern surfaces regularly across multiple timeframes. Setting up RSI as a secondary indicator alongside the candlestick chart takes about thirty seconds, and filtering signals down to daily charts eliminates the noise that makes intraday pattern trading so difficult for new traders.
The demo account on BTCdana lets you test your entry rules, practice setting stop losses correctly, and verify that your risk-to-reward ratios are realistic before you put actual capital on the line.
The platform also allows you to review historical setups by scrolling back through charts, which means you can study how the pattern performed in different market conditions rather than waiting for live opportunities to arise.
FAQ
Is the three white soldiers pattern reliable in forex? The pattern produces its best results on daily charts in major forex pairs like EUR/USD and GBP/USD, where institutional order flow is consistent enough to create meaningful follow-through. On the daily timeframe with proper confluence filters, the pattern achieves win rates in the 60% to 65% range across backtested data, which represents a genuine tradeable edge when combined with consistent risk management.
Does it work in crypto markets? Yes, but the dynamics differ. Crypto markets are more sentiment-driven and more prone to sharp reversals, which means the three white soldiers pattern in crypto can produce larger winning trades but also more dramatic failures. Applying stricter filters, specifically requiring daily chart setups with volume confirmation and clear support levels, reduces the false signal rate considerably in crypto environments like Bitcoin and Ethereum.
Can it be used for day trading? Technically yes, but the evidence strongly favors daily chart usage. Intraday three white soldiers formations on 15-minute or 1-hour charts generate far more signals but with substantially lower win rates, often falling below 50% without aggressive filtering. If you're determined to use it intraday, combining it with session-specific volume analysis and clear intraday support levels improves the odds, but the daily chart remains the superior application.
Should I combine it with other indicators? Absolutely. The pattern works best as part of a multi-confirmation system rather than a standalone entry trigger. RSI above 50 and rising, a price close above a meaningful moving average, and the presence of a clear support level at the pattern's base all add meaningful probability to the setup.
What is its average win rate? Across multiple markets and backtested datasets, the three white soldiers pattern on daily charts achieves a win rate between 55% and 65%, with gold and forex majors sitting toward the upper end of that range and crypto assets toward the lower end. The win rate figure only becomes meaningful, though, when paired with a risk-to-reward ratio of at least 1:2, which is what turns a 60% win rate into a genuinely profitable strategy.
Ready to put this into practice with real market data? Open your free BTCdana demo account today and start hunting for live three white soldiers setups across forex, crypto, and commodity charts, where every signal sharpens your pattern recognition without putting your capital at risk.