




Traders will typically fall into one of 2 categories. One type spends their entire day refreshing their news feed for the latest financial developments and responds to every GDP announcement or central bank statement without ever verifying that the company they’re investing in is financially healthy.
The other type spends all day going through balance sheets and earnings reports, but never even looks at the macroeconomic picture that is moving all sectors of the market either up or down. With either style of investing, there is a significant amount of profits that can be left on the table; learning the reason why is the first step in creating a trading strategy that is viable across different market environments.
The study of macroeconomics is viewed as the forest. It takes a greater view of the global economy with the goal of identifying the trends and changes happening at the macro level. It shows us how countries and global financial systems are doing and provides us with indicators such as GDP growth, inflation (CPI), interest rates, and unemployment. Therefore, an omission of macroeconomic data makes it impossible for you to navigate in a sailboat without knowing what direction the wind is blowing.
The study of microeconomics is viewed as the tree; as it relates to an entity, it focuses on determining how much power they have with respect to the pricing of their products, the current demand and supply conditions, the cost of producing their products, historical trends for the generation of cash flow, etc. This perspective will allow a trader to determine which interest to invest in and what the appropriate entry point would be.
Successful traders don’t choose to use the macro or micro perspective of the market; rather, they alternate between the 2 in the same manner that successful investors do.
They will use their macro analysis to identify where they are likely to find new trading opportunities; then use their micro analysis to select which specific instrument they will invest in and determine the best time to execute the trade. This guide will show you how to combine your macro and micro analysis to trade stocks, forex, or cryptocurrencies.
Macro as Telescope, Micro as Microscope
The simplest way to see how macro and micro analysis relate is by thinking about the two analyses as different tools for different tasks. A telescope shows you an area of land that your eyes can't see, while a microscope shows you details of the same land that the telescope cannot see. Both tools have value, but do not outdo each other.
Here's a side-by-side comparison of what each lens actually covers:
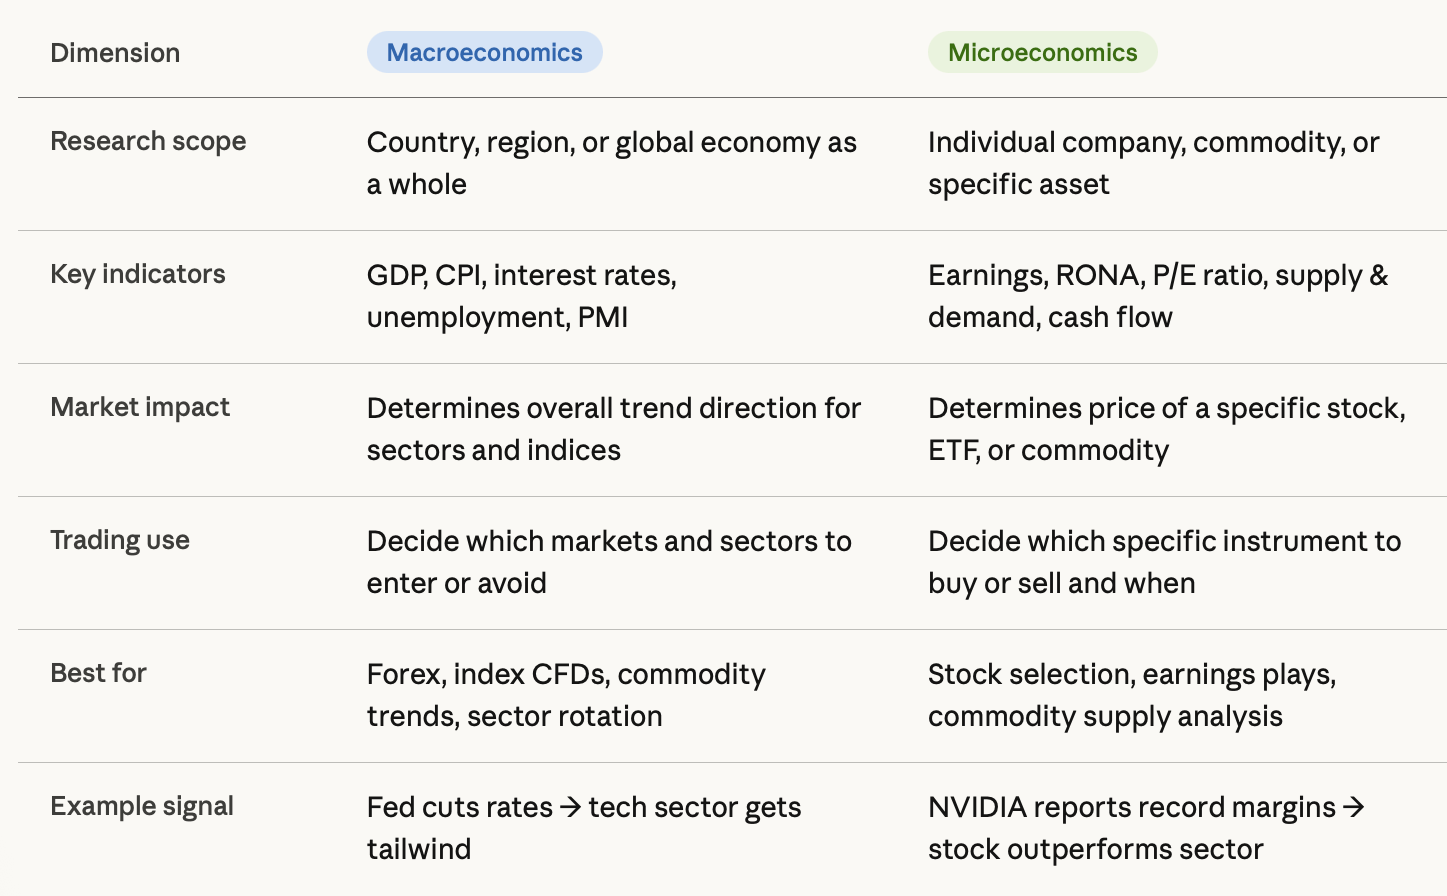
The big idea here is that macro and micro analysis complement, they do not supplant. As we can see in the figure, when the Federal Reserve cuts interest rates, the cost of borrowing drops across the entire economy. This means that companies can service their debt at a lower cost, and this leads to increased free cash flow, making future earnings more attractive to investors; so this is a macro-micro transmission of economic events.
On the other hand, if they saw dozens of large companies reporting weak earnings while there was a GDP report that had shown growth, this would signal a micro warning that something’s wrong with the macro data.
If you traded the US tech sector based solely on macro signals (i.e., Fed rate cuts) beginning in late 2024, you would have been a very aggressive buyer of the sector; however, if you also looked at individual company metrics such as margins and debt, you would have seen some companies were much better positioned than others due to their ability to benefit from the decrease in borrowing costs because they had better metrics. In this way, we see how both macro and micro work together as an entire ecosystem and impact each other.
Macro Insights: Reading the Big Trends
The macroeconomic indicators serve as your dashboard instruments in the economy's cockpit. Each indicator offers you individual insights into various economic indicators, such as altitude and direction. Together, they provide you with the information you will need to determine whether you are flying into clear air or turbulence.
GDP measures the total economic output of a country; therefore, rising GDP will usually support equity markets and can help strengthen a currency's value against other currencies on the forex market. Also, falling or negative GDP growth is associated with slowing or negative GDP growth and is a major factor leading to falling price quotes for equities, while often benefiting safe-haven assets, such as Gold or Government Bonds.
CPI is the index of Inflation. Rising CPI puts pressure on Central Banks to increase interest rates, which would lead to higher debt costs for businesses and cause erosion in stock valuations, primarily for growth-oriented companies, as their future earnings will be discounted at a much higher rate. Commodity prices (e.g. oil, gold) frequently rise in anticipation of inflation.
PMI is one of the best leading indicators because it is based on surveys of the decision-makers of businesses regarding future orders, production levels, and employment. A PMI Reading above 50 indicates expansion. A PMI Reading under 50 indicates contraction. In addition to the actual PMI number itself, the trend of PMI also plays an important role.
Central bank interest rates are possibly the most important macro variable for traders, so we will discuss these later.
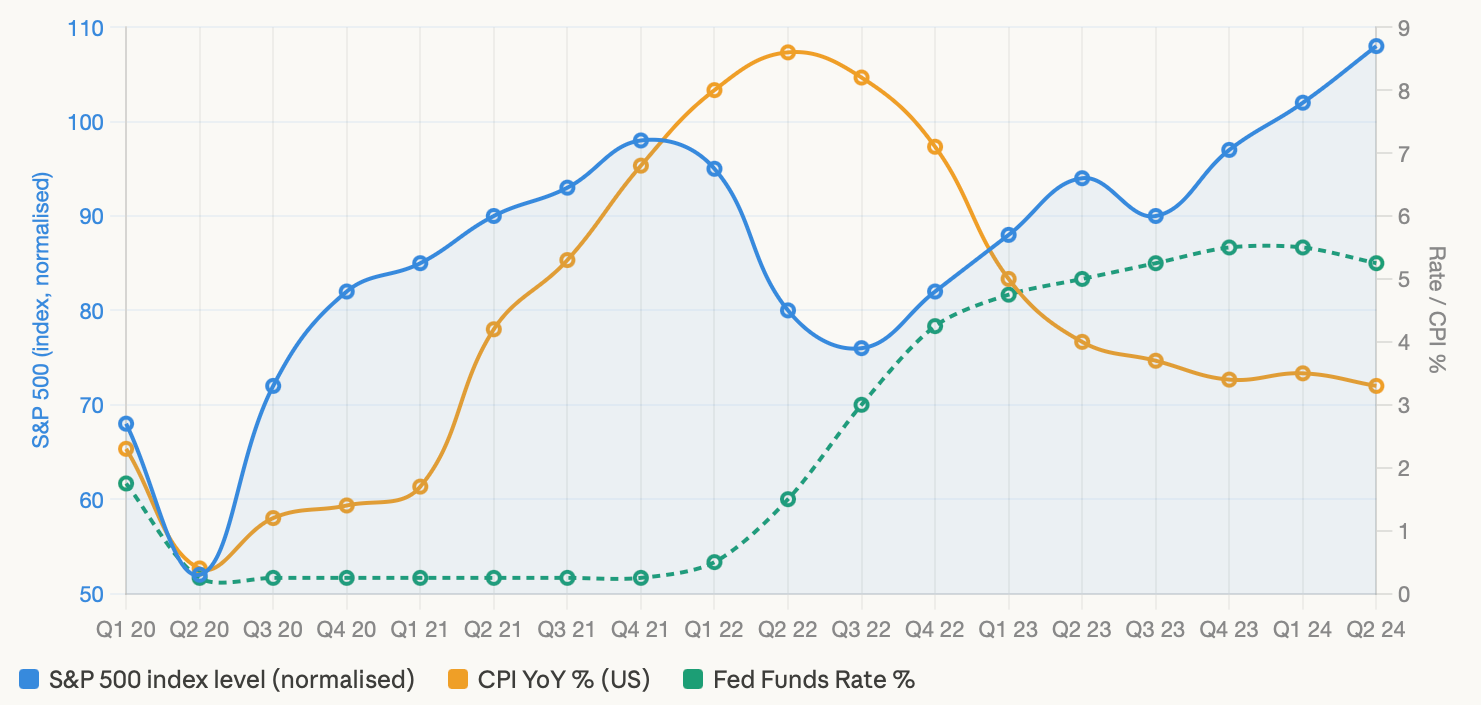
There is one important macro lesson to be learned from this chart of recent history: when CPI started to increase in early 2021 and continued to rise through 2022, and the Federal Reserve started raising interest rates aggressively, the S&P 500 fell sharply.
Those traders who only looked at earnings from companies in early 2022 and did not consider the impact of higher interest rates on valuations found themselves on the wrong side of the trade. The macro signals had been around for some time before there was any evidence of the damage on a micro level through earnings reports.
One way to form good habits in the development of a successful trader is to create a classification system for macroeconomic indicators by looking at which indicators lead changes in the economy and which are lagging indicators. Leading indicators include PMIs and consumer sentiment surveys.
Leading indicators will typically move prior to any significant changes occurring within the larger economic environment, while lagging indicators are official statistics, such as GDP and employment numbers, that confirm what has occurred. Combining leading indicators with a technical signal will provide you with one of the best opportunities to enter into either forex or index CFD trades.
Micro Insights: Getting Asset-Level Precision
After analysing the macro conditions and determining what the appropriate sector would be for trading, the second part of our analysis will also determine exactly where we will want to place the trade and when we should do so.
While there are many variables to consider regarding micro analysis for stocks and equity CFDs, some of the most important things include earnings growth trajectory, RONA, free cash flow being generated and positioning of the company within its competitive space.
A company may fall in our macro category of favourable, but if the company has shrinking margins or accumulating liabilities at a faster rate than its revenues, it would cause that company to be a poor performer relative to its peers.
For example, when you consider the semiconductor hardware supply shortage that occurred from 2021 through 2023, you can see macro conditions were mostly in place to support the technology sector; however, if you look at micro conditions for supply-side companies, you will see there was a large range of successful and unsatisfactory results.
The best-performing companies were companies that had multilateral supplier relationships and were well financed, while other companies that were more exposed to single-source supplier relationships performed poorly. Traders who took advantage of the macro tailwind and applied micro analysis were able to create better positions.
As for commodity traders, the micro analysis examines the supply-side fundamentals, such as crop reports, expected outages in production, current inventory levels, and freight rates.
For example, in 2024, coffee prices increased significantly due to a short crop output by the primary coffee-growing regions in Brazil and Vietnam. The overall macro environment was favourable with moderate inflation and moderate consumer spending, but the reason for the change in coffee prices was strictly micro and related to weather and crop failures.
The Top-Down Profit Model: Three Steps to Better Stock Selection
The most structured way to combine macro and micro analysis is the top-down approach, which moves through three distinct levels before committing to a trade. Here's how the framework flows:
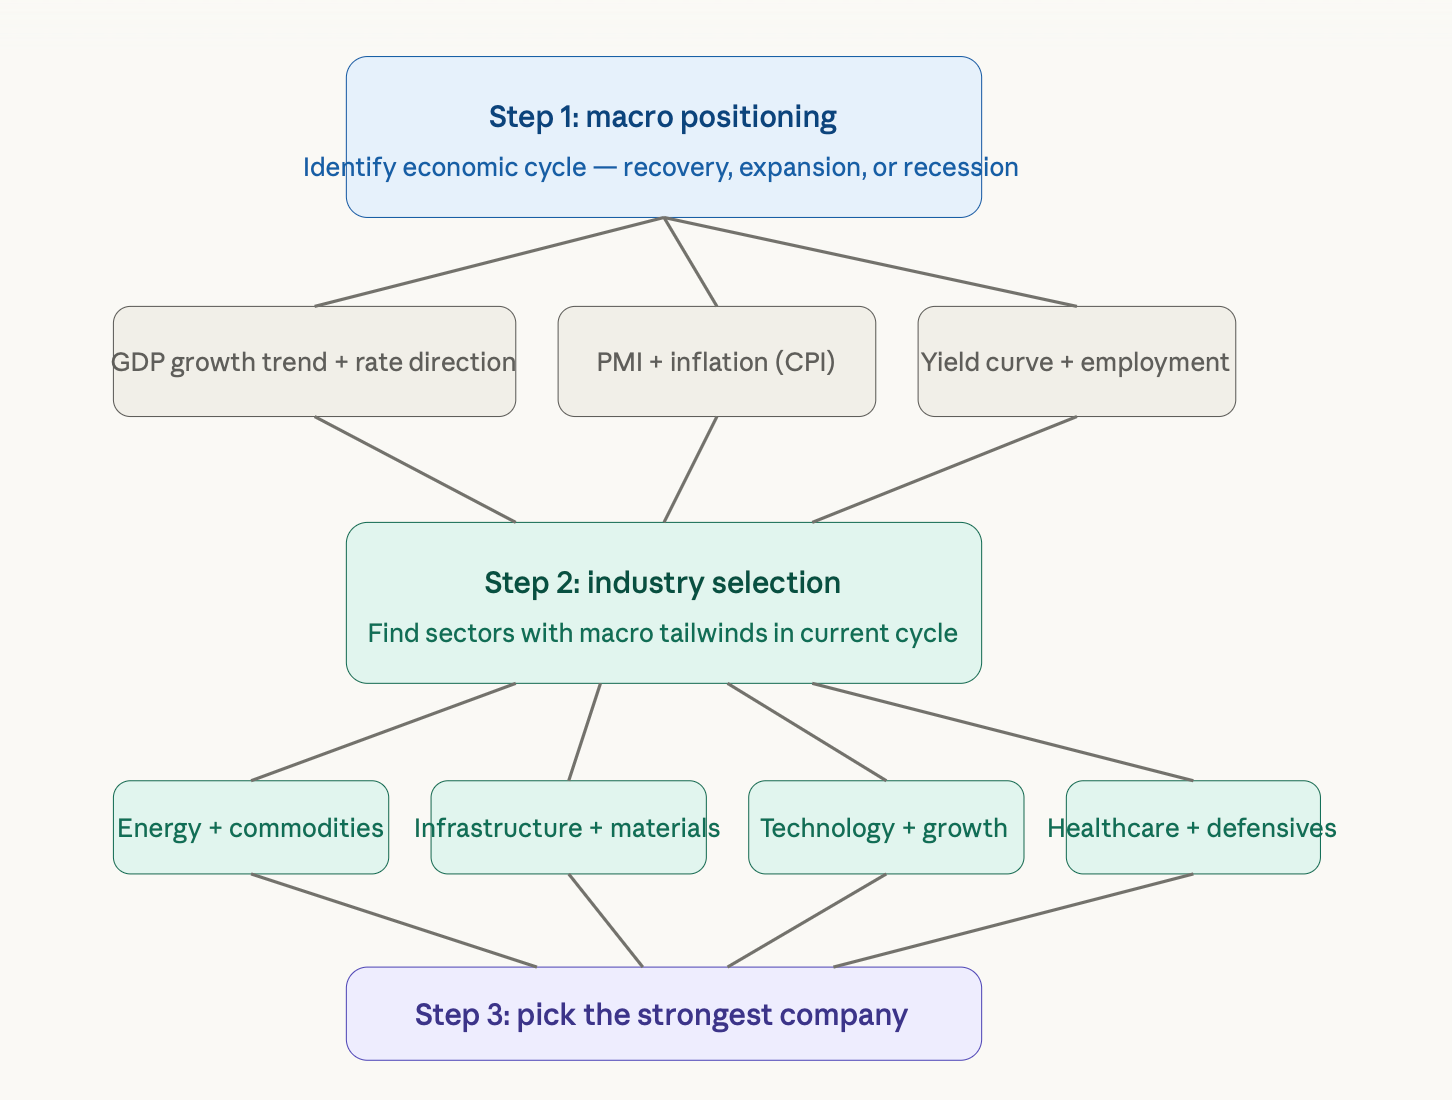
Step 1 - Macro positioning involves determining the business cycle's current stage and positioning accordingly. Sectors like technology, industrials, and materials typically thrive during an economic recovery and expansion, while energy and commodity-linked sectors excel in a late-cycle expansion. A recession will typically create a flow of capital into defensive-type investments such as utilities, healthcare, and consumer staples. The macro cycle influences all subsequent elements of the trading strategy.
Step 2 - The next step is to identify the industry's specific macro tailwind, allowing you to narrow the universe. Sectors benefiting from macro tailwinds in 2022 were energy and commodities. The companies and quality of companies in these sectors were secondary to the macro backdrop, pushing the entire industry higher. Sorecognising and acting on the macro tailwind earlier had far more value than finding the best stock.
Step 3 - Company selection is accomplished through the use of micro-analysis techniques. Once you have identified the potential sectors, you can analyse the companies within the sectors on key metrics such as RONA, free cash flow yield, debt/equity, and competitive moats. The company with the highest score relative to all other companies within the same sector will be the best candidate for a long-term position.
Risk Management: Avoiding the Fallacy of Composition
When it comes to trading, one of the biggest cognitive pitfalls a trader can encounter is the fallacy of composition. This is when a trader thinks that something which works at the micro level must also work at the macro level. For example, in economics, if one household saves a larger portion of its income, then they become wealthier.
However, if all households throughout the country save at the same time, then consumer spending nationwide falls to zero; businesses lose revenue; the economy contracts; in short, the action that benefits an individual destroys the overall outcome.
In the case of trading, there is a tangible and costly example of this cognitive mirage: while a strong GDP growth rate may be indicative of growth at the macro-economic level, it does not necessarily mean that US corporations are expanding their profitability in terms of their margins.
In fact, late in the economic cycle, there can be a strong GDP growth rate and contracting margins due to rising input costs and wage increases that exceed a corporation's ability to pass costs along to the end-consumer. The combination of a "macro good, micro bad" scenario is typically viewed as a peak signal within the market. Traders who viewed the GDP headlines only at the beginning of 2022 found themselves very wrong-headed in this situation and suffered a significant loss from this decline.
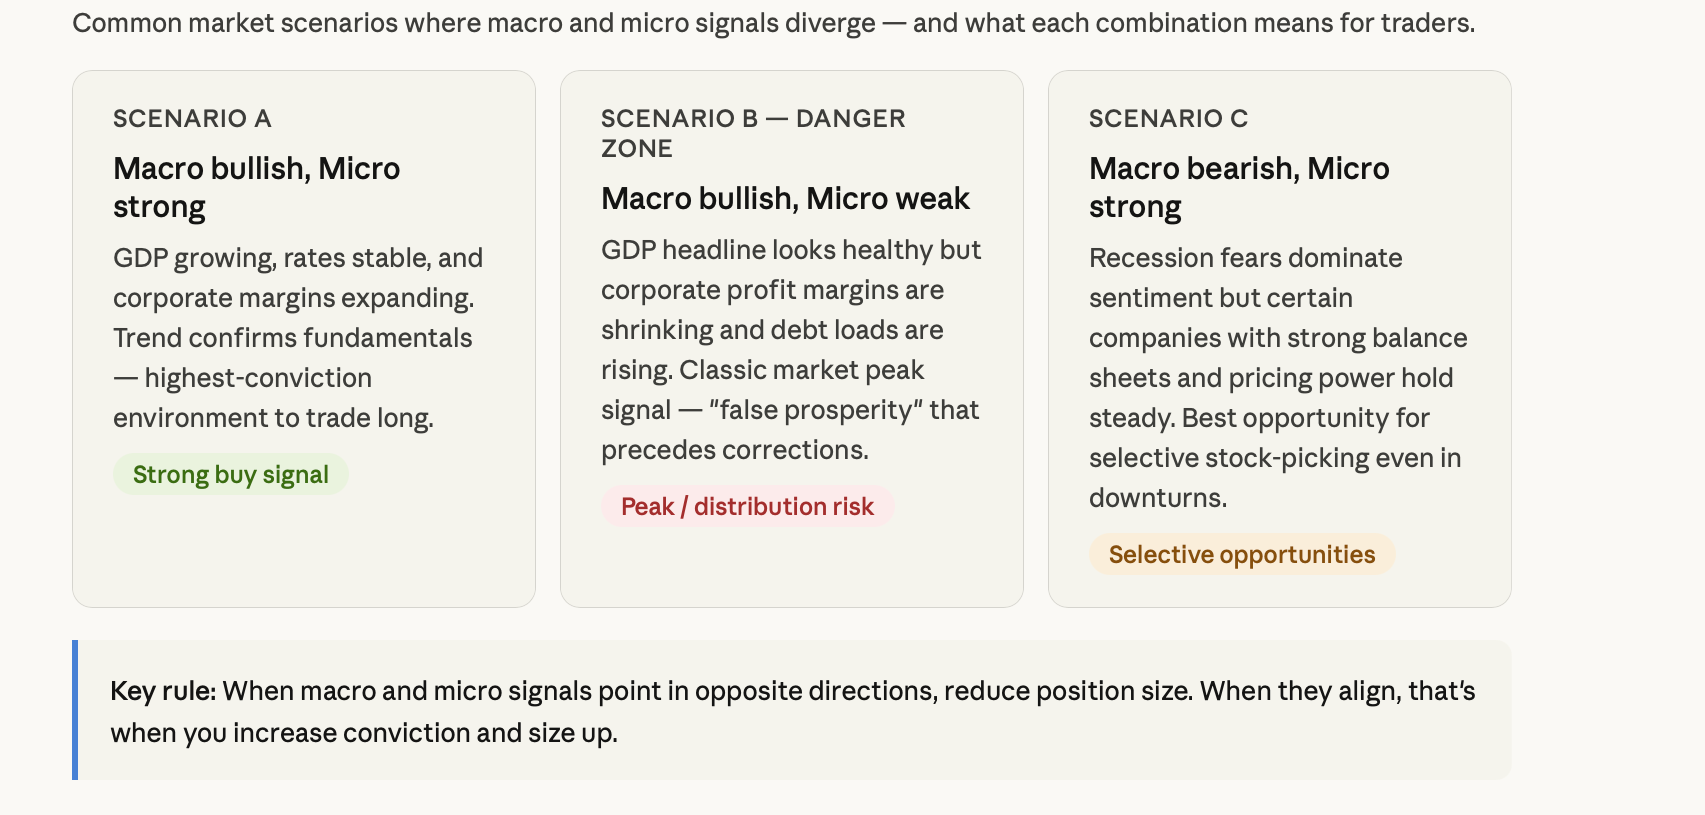
The practical risk management rule that follows from this is straightforward: when your macro and micro signals align, that's when you size up with conviction. When they diverge, reduce your exposure and wait for the divergence to resolve before committing capital. The divergence itself is valuable information, and it often signals that a major trend reversal is approaching.
Policy Transmission: How the Fed Reaches Your Portfolio
Interest rates serve as the most potent means of transmitting macroeconomic policy to microeconomic asset valuations, therefore giving savvy traders an advantage when they understand this transmission process. As the Federal Reserve increases its benchmark interest rate, it has a predictable impact on all aspects of the economy with respect to a series of events that create multiple levels of actionable signals for traders.
The macroeconomic impact of increased interest rates is a reduction in overall economic activity due to increased costs of borrowing to both businesses and consumers. However, the impact of increased rates on individual corporations can be widely divergent.
A tech company that finances its growth through debt will see its market valuation decrease significantly when interest rates rise because the increased cost associated with discounting future earnings will decrease their present value.
However, a utility company has predictable cash flow and very low debt; therefore, while it will also be adversely affected by increased interest rates, the reason is different. Increased interest rates will make a utility company's fixed dividends appear less attractive than safer alternatives such as bonds.
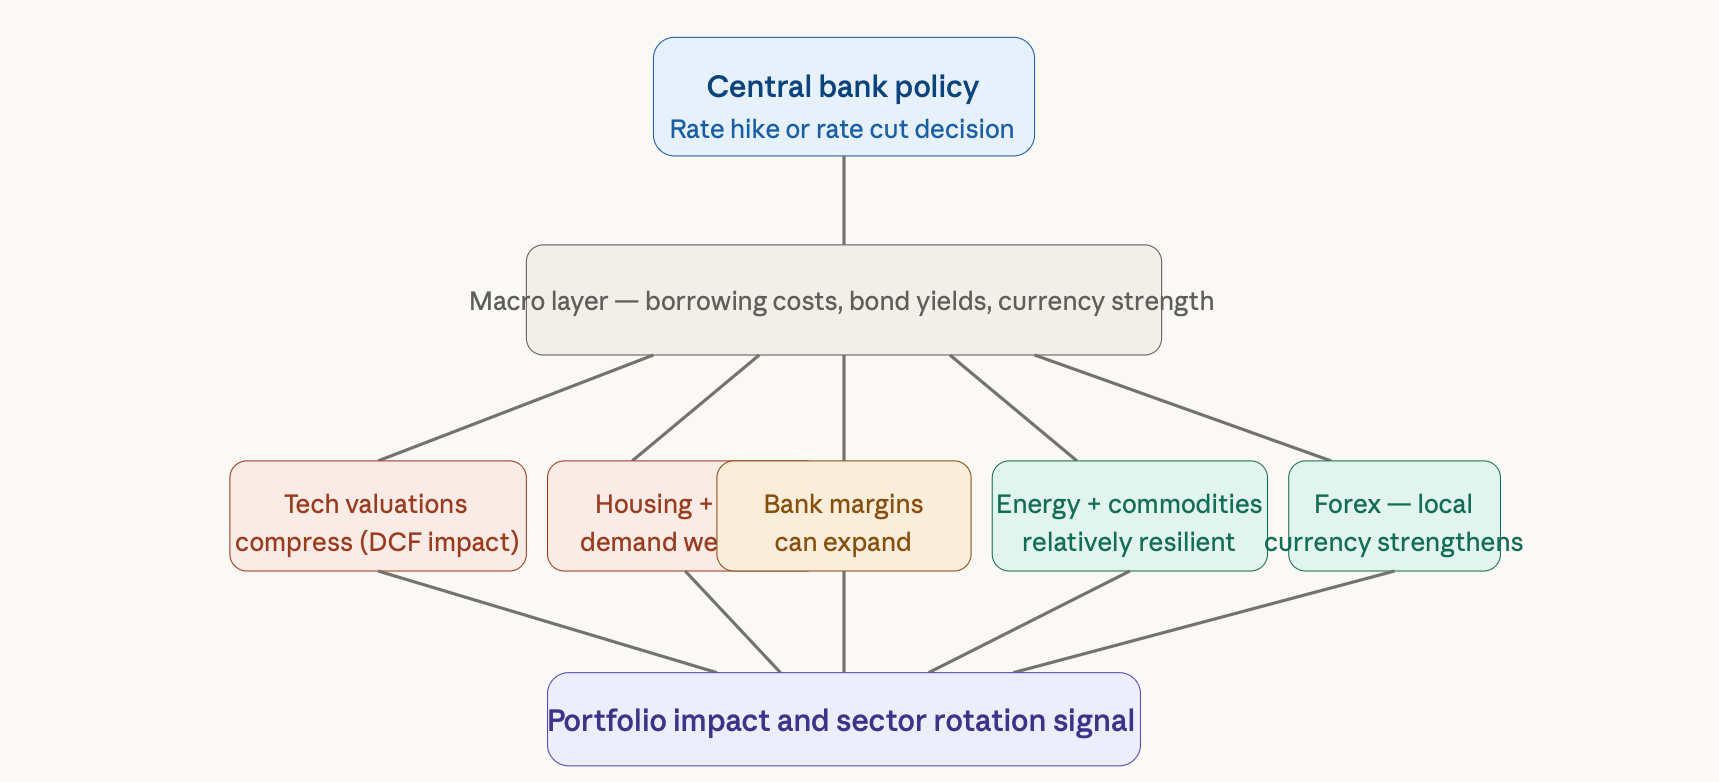
During the 2022 to 2023 rate hikes, this transmission effect was very clear. The tech stocks experienced the most significant adjustment due to their high P/E ratios, which is exactly what the investors expected. Conversely, energy companies, which were producing large amounts of cash from commodity prices, performed relatively well. Knowing where different sectors fall on the rate sensitivity spectrum is one of the better examples of macro/micro integration applied to your trading.
The forex market experiences transmission through interest rate differentials. When the Federal Reserve increases rates and major central banks keep their rates steady, capital will typically flow toward the higher yield US dollar, thereby appreciate against other currencies. Keeping track of the pace and direction of rates diverging between central banks is a great macro framework for forex traders to position themselves in the major currency pairs.
Behavioral Economics and Real-Time Monitoring
Despite the importance of fundamental analysis, many traders disregard the psychological component of analysis. Understanding how investors respond to various stimuli can have a significant impact on asset prices, pushing them above what would be considered fair value based on fundamentals alone.
The price of an asset can be far removed from its rational value for an extended period of time as a result of investor behavior based on emotions, such as fear and greed, or based on the herd mentality found among retail investors.
At the macro level, the impact of investor behavior results in the formation of bubbles in the asset market. The example of the cryptocurrency market in late 2021 is an example of this behaviour. Most cryptocurrencies were created for no other purpose than speculation due to their lack of utility or cashflow.
However, near-zero interest rates and the increase in money supply due to quantitative easing created the perfect recipe for excessive speculation among retail investors, which ultimately led to the formation of a speculation-based bubble. Traders who monitored both macro conditions, i.e. liquidity being reduced, and behaviour, i.e. unrealistic prices, had the ability to exit their positions at a better time than if they had monitored either factor independently.
The best method to facilitate the incorporation of the analysis above into your trading strategies in real time, is through the use of a personal monitoring dashboard that integrates both macroeconomic indicators, such as non-farm payrolls, CPI releases and central bank communications, with microeconomic indicators, such as the volatility of stocks you have positioned yourself in, trends in earnings revisions and fund flows into different sectors.
Websites, such as BTCDANA, allow you to access a similar type of data and view how they are interacting with each other in real time.
What You Need to Know About Macro vs Micro Economics
To effectively combine macro and micro economic analysis when trading, one must use both. Macro economic analysis provides traders with a broad sense of market direction as well as fuzzy indicators of which sectors or asset classes have the most sustained momentum. Micro economic analysis provides traders with the specific instruments they can trade in order to capitalize on macro economic trends. The consistent execution of both analyses separates those traders who sustain large profits from those who get trapped on the bottom side of a major price correction.
Frequently Asked Questions
What is the difference between macroeconomic and microeconomic analysis? Macroeconomic analysis looks at the overall economy through indicators like GDP, inflation, and interest rates to identify broad market trends. Microeconomic analysis focuses on individual companies, sectors, or assets using metrics like earnings, supply and demand dynamics, and cash flow to find specific trading opportunities.
Can you succeed by only following macro news? Macro signals tell you the direction of the wind, but they don't tell you which specific boat is best built to sail in it. Traders who only follow macro news tend to enter broad sector positions and miss the significantly better returns available by selecting the strongest individual instruments within that sector using micro analysis.
How do microeconomic factors influence trading decisions? Micro factors like earnings beats, supply shocks, or margin expansion can drive a stock or commodity to outperform its entire sector even when the macro backdrop is mixed. Identifying these micro catalysts ahead of the crowd, and combining them with macro context, is where alpha gets generated.
Which macro indicators matter most for forex trading? Interest rate decisions and their expected forward path are the most powerful drivers of currency pairs. CPI data matters because it shapes rate expectations. Employment figures (particularly non-farm payrolls in the US) round out the core forex macro toolkit because they influence both rate decisions and currency strength directly.
How do you combine macro and micro analysis for CFD trading? The top-down approach works well for CFDs: use macro analysis to identify which index, sector, or commodity has a near-term tailwind, then use micro analysis (technical levels, earnings catalysts, supply data) to time the entry and manage the position around specific events.
Ready to put macro and micro analysis to work on live markets? BTCDANA gives you real-time macro data, individual asset screening, and multi-market execution across forex, CFDs, and crypto — all from a single platform. Start trading smarter at btcdana.com