



Most traders spend the majority of their time watching price charts, studying candlestick patterns, and tracking market sentiment. That focus makes sense, but it leaves a significant blind spot. The real story of a company's financial health is written long before prices move, buried inside financial statements that most retail traders never bother to open.
When you know how to read a balance sheet alongside a cash flow statement, you can often see trouble coming months before it shows up in a stock's price action. Traders who want to combine this kind of financial analysis with live market opportunities can explore global trading markets on the BTCDana platform.
What is a Balance Sheet? A balance sheet is a financial statement that shows a company's assets, liabilities, and shareholder equity at a specific point in time. Traders analyse balance sheets alongside the cash flow statement to evaluate financial stability, debt levels, and potential risks before making trading or investment decisions.
Why Every Trader Should Understand a Balance Sheet Before Trading
Whether you are a trader in stock, CFD, or cryptocurrency markets, it can be difficult at times not to rely solely on technical analysis as part of your decision-making process. The same holds regardless of what types of products you are trading to gain an edge in your marketplace using moving averages, volume profiles, and resistance/support levels as analysis tools in your trading strategy can provide valuable information regarding what is happening in the marketplace today, but will not provide any insight into whether or not the company being evaluated has a strong fundamental base from which to continue operating or is slowly deteriorating.
Fundamental analysis bridges the gap between the two by assessing the company’s actual financial structure, which will provide a more comprehensive understanding of the true value of the company's stock price.
There are three core financial statements that every serious trader should thoroughly understand, each of which will answer a different question regarding the company being analysed.
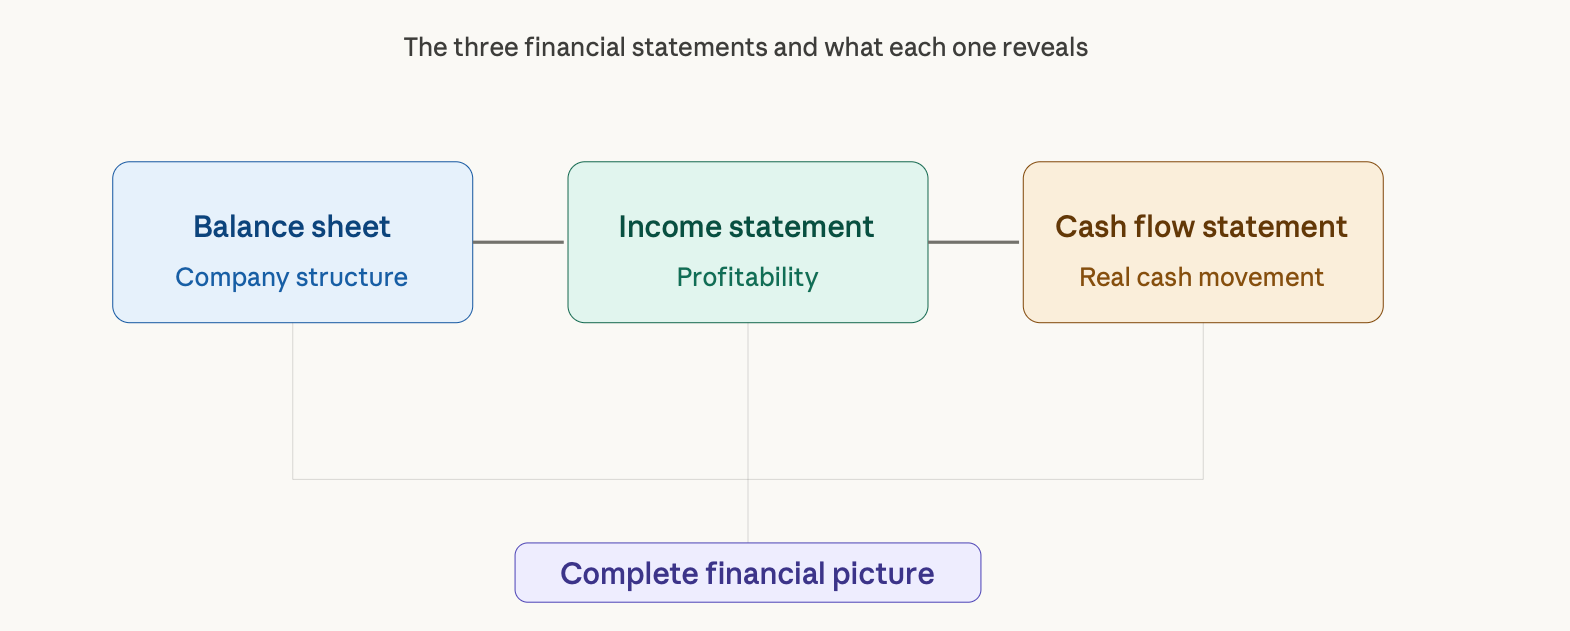
The balance sheet shows you how a business is structured; what it has in assets; how much debt it owes, etc. The Income Statement shows whether or not a business is making money.
The Cash Flow Statement shows whether cash is actually flowing through the business in the direction it should. A combination of these statements provides a complete picture of a business that no other single chart or price indicator can create.
The most important lesson that traders learn with experience is that profits can be skewed. Things such as timing for recognising revenue, the assumptions used in accounting, and methods for depreciation allow companies to make their profits look better than they really are, and ultimately obtain financing based upon false earnings. Cash flow is much harder for companies to manipulate because cash either exists in the bank account or it does not. Many financial frauds, including the spectacular collapse of Enron in the early 2000s, left distinct and obvious evidence on the balance sheet long before the rest of the world realised something was wrong. Therefore, the balance sheet is the earliest warning system available to anyone who trades and knows how to understand it.
Balance Sheet Explained: The Financial Snapshot Every Trader Must Read
At its core, a balance sheet rests on one simple equation that never changes, no matter the size of the company being analysed.
Assets = Liabilities + Shareholder Equity
An organisation’s balance sheet is divided into three categories. Assets are the resources owned by the business, such as cash, inventory, accounts receivable, and real estate. Liabilities are the obligations owed by the business, including loans, bonds, and accounts payable. Shareholders’ equity represents what can be returned to the owners after all liabilities have been paid from total assets.
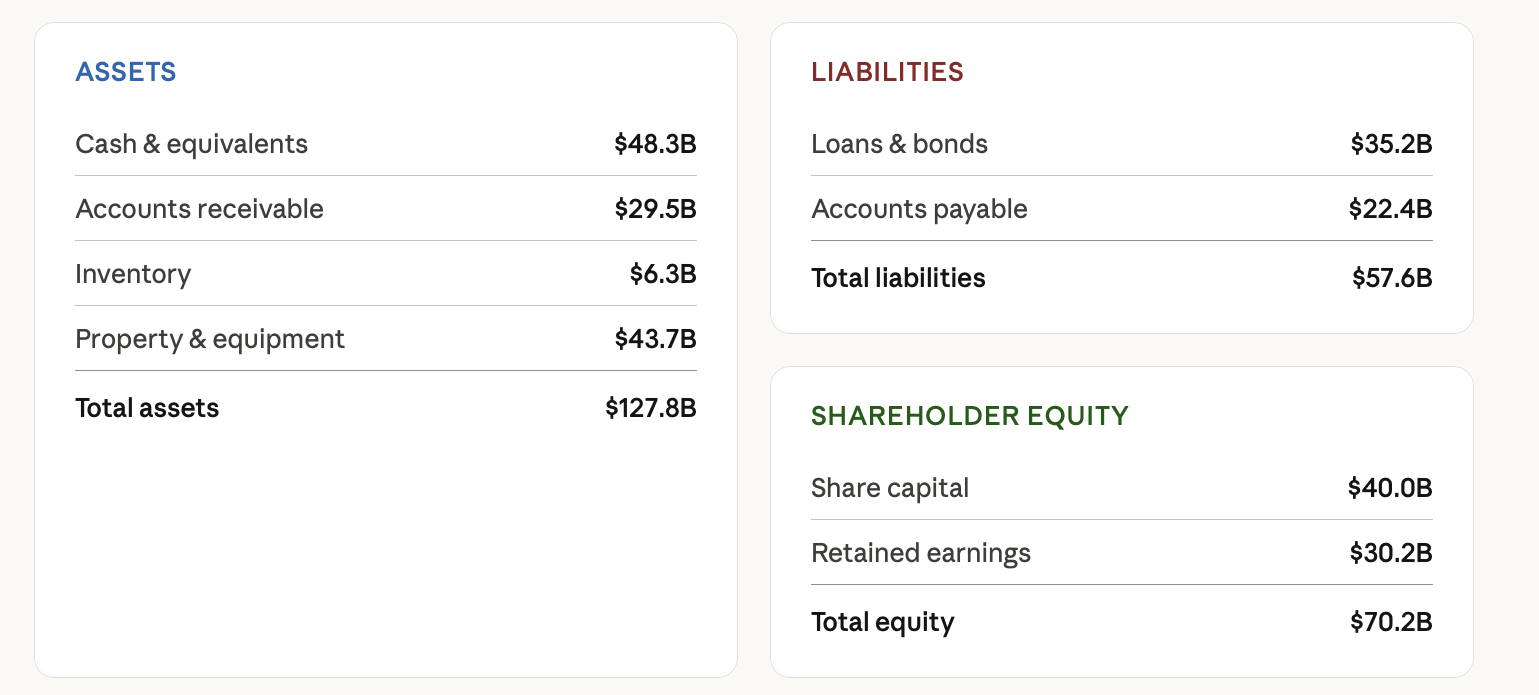
A balance sheet shows what a company has, what it owes and what will be left over for its shareholders after meeting its liabilities.
When an analyst examines the balance sheet of a company such as Apple, one of the most important and visible components is the significant amount of cash that Apple has accumulated. This tells a very different story from a company with a similar amount of assets, but with a significant amount of debt on its balance sheet.
Just because a company has a lot of assets doesn’t mean the company has good financial health. The way the company structures all of its assets, as well as the liabilities that sit on the other side of the balance sheet, is what will ultimately tell you whether the company is financially sound.
How a Balance Sheet Can Reveal Hidden Financial Fraud
Most retail traders are unaware that financial manipulation is rampant and usually leaves "fingerprints" on a company's balance sheet before becoming public knowledge. Companies generally use three main methods to artificially inflate their financials.
The first method is the use of off-balance sheet financing through elaborate “subsidiary” types of structures or using financial arrangements that allow a company to keep certain debts off its official balance sheet. The second method is to substantially inflate asset values or, in extreme cases, invent assets altogether. The third method is to record revenue that has not yet been received or has been paid by cash; thereby inflating revenue without any corresponding increase in cash.
In addition to the three methods noted above, there are many other accounting adjustments related to depreciation methods, revenue recognition timing, and accounting estimates that companies use to manipulate their profit figures so that they appear to be legitimate. However, cross-referencing profit figures to a company's balance sheet will usually reveal some discrepancies in the form of increasing accounts receivable, declining cash balances, or an asset balance that cannot be reconciled to the reported income.
The collapse of Wirecard in 2020 is one of the clearest examples of this. The company reported nearly €1.9 billion worth of cash in its accounts, which, according to auditors and investigators, didn’t actually exist. Traders and analysts who had scrutinised Wirecard's accounts for several years flagged concerns regarding the numbers reported.
At the same time, the market had treated Wirecard as a growth stock for several years. The lesson learned is that atypical numbers on a company’s balance sheet may indicate unresolved issues or serious financial difficulties long before those difficulties are reported in the media.
Debt-to-Equity Ratio: The Most Important Risk Indicator on a Balance Sheet
Once you can read a balance sheet, the next step is learning to use it. The debt-to-equity ratio is the single most useful calculation a trader can extract from balance sheet data when assessing financial risk.
Debt-to-Equity Ratio = Total Liabilities / Shareholder Equity
The debt-to-equity ratio indicates the proportion of the company’s operations financed by debt instead of funded with shareholder capital. When the company has $80 in debt and only has $20 of shareholder equity, the company has a Debt to Equity Ratio greater than 4.0, indicating significant leverage and that a minor increase in interest expense or slight reduction in revenue could place severe financial pressure on the company.
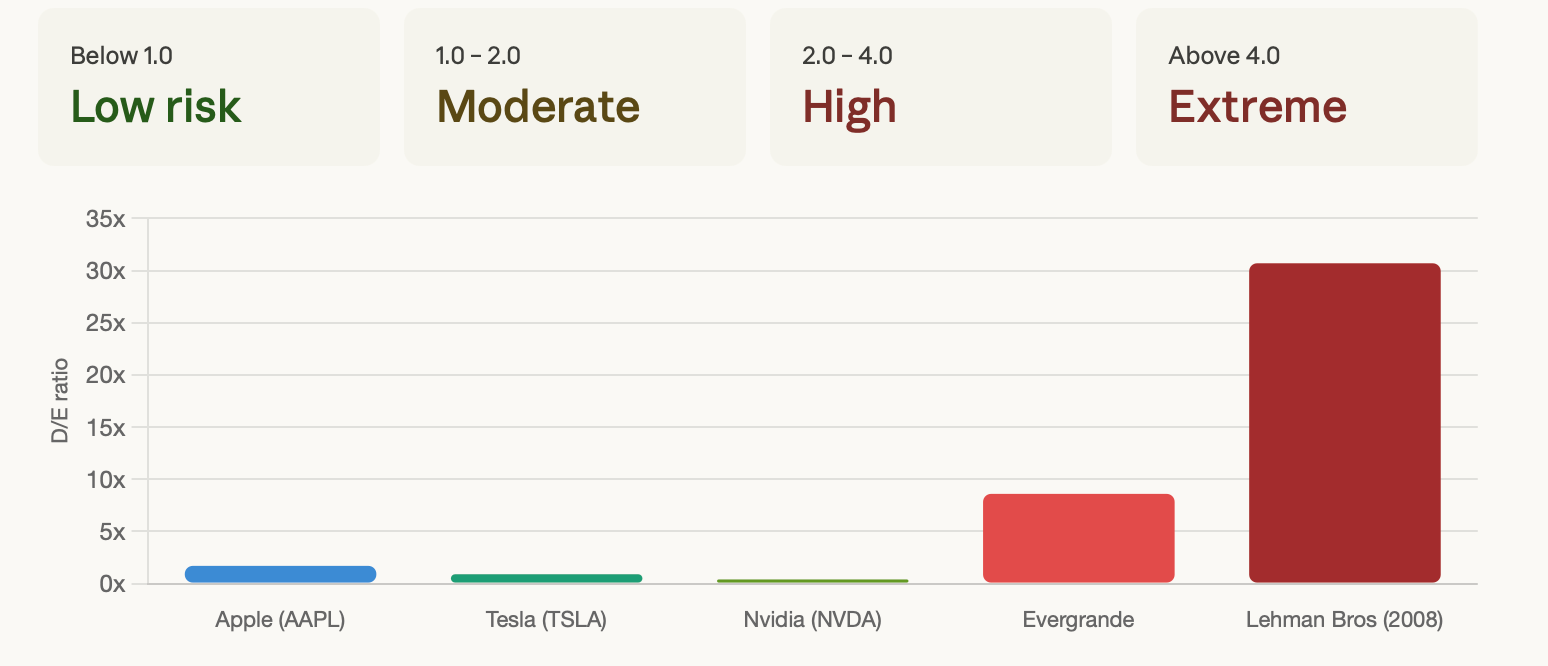
Evergrande Group's experience demonstrates how a real estate sector slowdown can lead to an unsustainable level of leverage for a firm. With an extraordinarily high debt-to-equity ratio after years of borrowing heavily to fund growth, Evergrande, as sales began to decline, was unable to keep up with its interest payments because its cash flow simply wasn’t high enough.
The fallout from the Evergrande crisis led to a dramatic plunge in stock prices globally, resulting in a massive loss of investor wealth. When an organisation has too much debt, it can lead to its demise, even though the company may be currently profitable because of changing market conditions, and an excessively high debt-to-equity ratio is a leading indicator that the company is likely to be headed toward that kind of situation.
The Most Dangerous Assets on a Balance Sheet: Accounts Receivable and Goodwill
"Accounts Receivable" are strongly associated with a company’s current assets and its short-term financial performance. They reflect money owed to the company by customers, and they can distort a company’s financial position because a company can record revenue at the time of sale even if the payment has not yet been received.
If Accounts Receivable grows more rapidly than revenue, it can mean that the company is recognising sales where customers have not yet paid. If this trend continues, it could also indicate that there are actually no sales to recognise at all.
Goodwill is an intangible asset that appears on a company’s balance sheet when the company pays a premium for acquired assets above their fair value. Until the value of that goodwill is dissolved or written off, the company’s balance sheet contains an inflated amount of assets.
Goodwill impairment, which occurs when a company writes down the amount of goodwill recorded on its balance sheet due to an unsuccessful acquisition, can cause a precipitous decline in the total amount of reported assets by the company, sometimes resulting in billions of dollars in write-downs. An example would be Kraft Heinz, which was recently written down for billions of dollars of goodwill. This write-down shocked investors who had not adequately tracked the company's balance sheet.
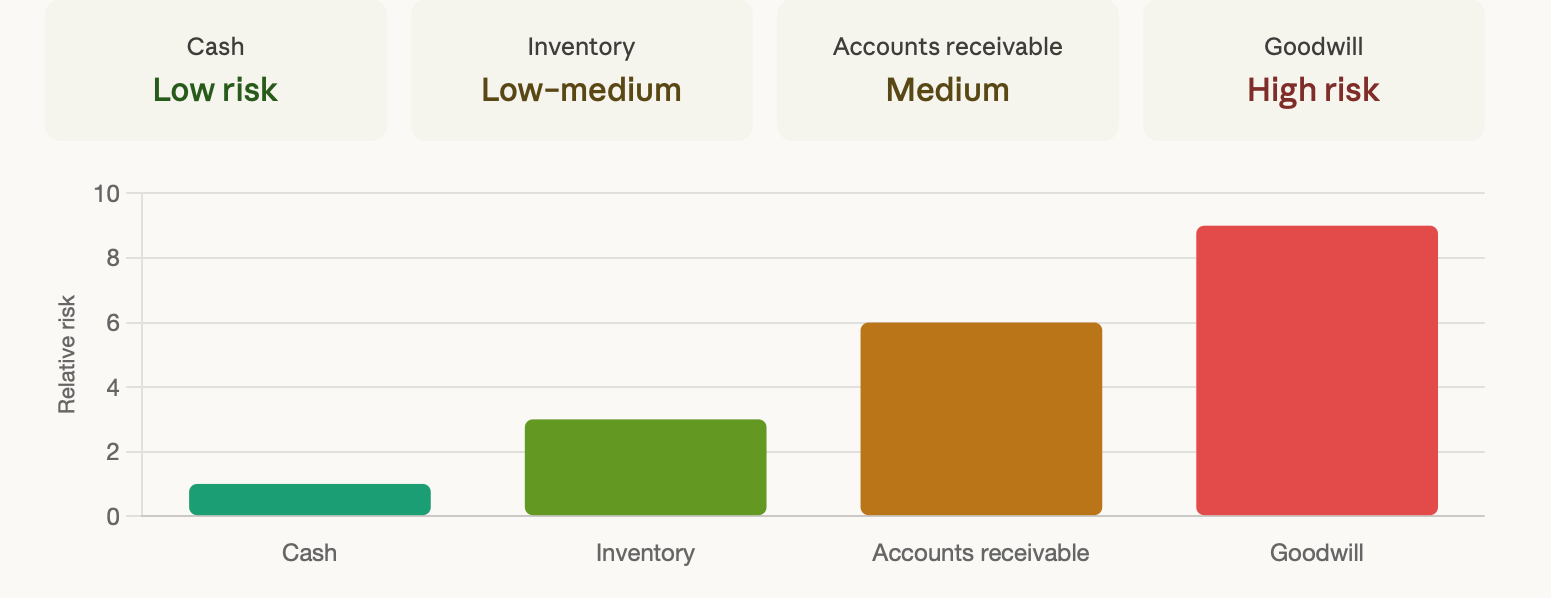
Rapid growth in accounts receivable is one of the clearest warning signs you'll find on a balance sheet. When you see receivables growing at two or three times the rate of revenue, you need to ask whether those sales are real and whether the cash will ever actually arrive.
Balance Sheet vs Cash Flow Statement: The Truth Behind Company Profits
For traders looking to improve their decision-making processes, being well-versed in financial statements can provide valuable insight into the potential risks associated with all asset classes and help them realise the performance of a corporation through the same analytical principles that exist within public equities.
By using this form of analysis on behalf of the entire financial markets, this can give traders the opportunity to develop a greater understanding of how a company will ultimately perform and what impact it will have on their investments.
A company's cash flow statement can be divided into three distinct components. The cash from operating activities indicates whether or not a company's business operations are actually generating cash. The cash from investing activities measures the amount spent or received on capital expenditures, including acquisitions. Finally, the cash from financing activities measures how a company raises or returns funds through debt and equity.
The key principle to remember is that when reported profits are increasing, but cash from operating activities is declining, something is likely to be wrong. Although a corporation may be experiencing many levels of profit on its books, it is likely to be living on borrowed time if it is not generating enough cash from its core business.
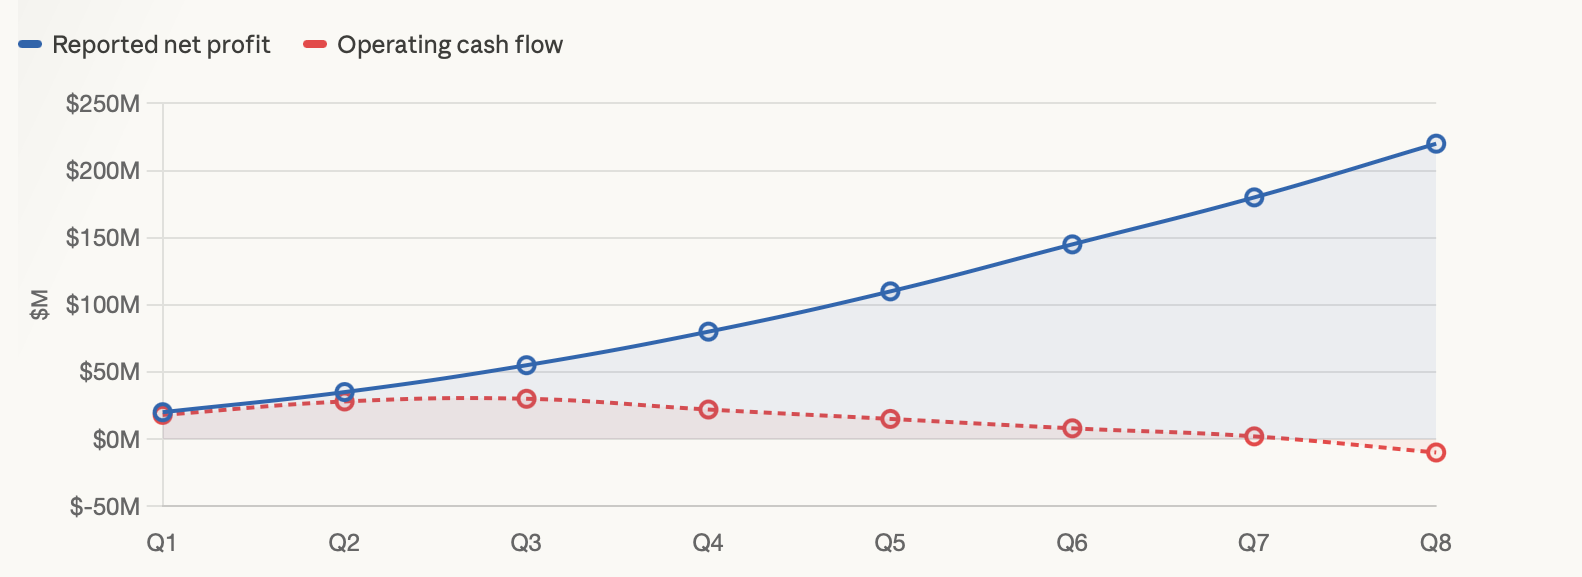
The Luckin Coffee accounting fraud was an example of this gap. The company reported strong revenue growth that attracted substantial investment, but the cash flow statement provided a significantly different picture. Specifically, reported income was inconsistent with actual cash movements; as such, when the investigators took a closer look, they discovered that the company had created hundreds of millions in sales.
When cash flow diverges from reported profit, that divergence is a red flag that should command your full attention.
Real Market Lessons: Companies That Collapsed Under Excessive Debt
Past and recent evidence have demonstrated that if a company's balance sheet deteriorates to the point at which recovery is impossible, it will result in the immediate loss of confidence, subsequently resulting in an immediate collapse of that company.
Such was the case with FTX Trading Ltd. (FTX) in 2022. On its surface, FTX appeared to be a healthy, profitable and well-run company; however, when one looked more closely at the FTX balance sheet, it became apparent that it used customer deposits to fund excessive risk-taking by using them as collateral for loans made to its affiliated trading firm.
The company's off-balance-sheet liabilities were real, but the company's balance sheet did not present the offsetting assets that would render those liabilities of equal value. FTX went from having the appearance of a viable company on Monday, October 24, 2022, to insolvent (i.e., a company's ability to pay its debts as they become due) on Wednesday, October 26, 2022, after only a few days of questions regarding the veracity of the FTX balance sheet.
Lehman Brothers Holdings Inc. (Lehman) is the other, more widely studied example of the consequences associated with excessive leverage on a company's balance sheet (i.e., the ratio of a company's total liabilities to total equity).
Lehman leveraged itself by borrowing excessively against and/or using its own assets to finance its very high levels of leverage in its mortgage-related positions (i.e., debts related to real estate) and reached a debt-to-equity ratio of approximately 30:1 at its peak (i.e., 30 units of debt for every one unit of equity).
When the value of the assets underlying Lehman's debt decreased even slightly, the value of Lehman's equity was wiped out completely and the company that had withstood wars, recessions and financial market downturns over the course of more than 100 years was virtually insolvent as a consequence of the very high leverage ratio that any prudent balance sheet analyst would have identified long before the 2008 financial crisis occurred.
Also, excessive amounts of leverage both amplify absorption of and loss of excess cash flow. Therefore, when a company's operations are strong, high levels of leverage provide a highly accelerated rate of return on capital invested in the business. Conversely, when a company's operations have little or no positive cash flow, high levels of leverage provide a highly accelerated rate of decline on that capital.
The 5-Minute Balance Sheet Checklist Every Trader Should Use
You don't need to spend hours poring over financial statements to catch most major red flags. A focused, systematic check of five key areas will surface the majority of serious problems before they become public crises.
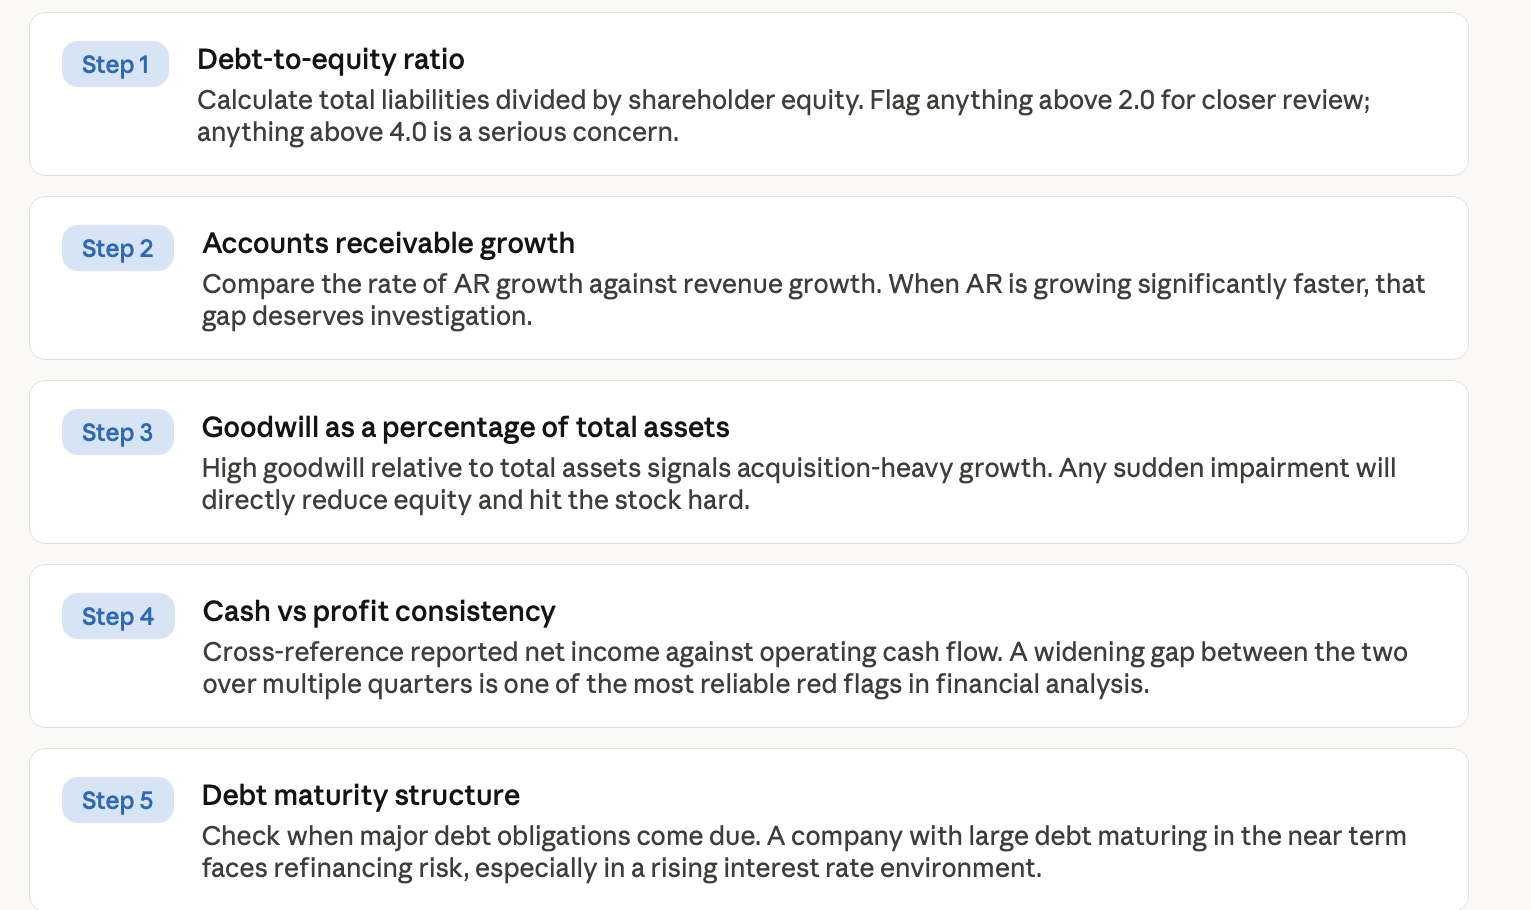
Even a quick pass through these five checkpoints can prevent the kind of expensive mistakes that come from trading based on price action alone. The market is often slow to price in fundamental deterioration, which means traders who do this homework early have a genuine edge over those who don't.
Final Thoughts: Use Financial Statements as Your Trading Radar
Technical analysis and price charts have a major effect on how traders make their decisions, and both of these approaches have real merits. Traders who blend technical analysis with fundamental analysis have an extra layer of information to make their decisions, which pure chart readers do not, and that is, what the price has not already reflected.
The big three financial red flags are a company with a lot more debt than equity, asset values that do not stand up when they are scrutinised, and cash flow that is always less than reported profits. When these three issues happen at the same time, it is usually a precursor of a price correction. Traders who identify and take note of early warning signs and are then able to make adjustments to their trading positions in advance are likely to be successful.
Understanding how to do financial analysis is a skill that requires practice to improve at. Start by reading the quarterly filings of companies that you know. As you read those, you should cross-reference the balance sheet to the cash flow statement for the same period. Over time, you will become familiar with the trends, and those red flags that you may not have recognised in the past will be harder for companies to conceal.
Frequently Asked Questions
What is a balance sheet in simple terms? A balance sheet is a financial statement that shows what a company owns, what it owes, and the value remaining for shareholders at a specific moment in time.
What are the three main parts of a balance sheet? The three core components are assets, liabilities, and shareholders' equity. Every item on a balance sheet belongs to one of these three categories, and the equation assets = liabilities + equity always holds true.
What is the difference between a balance sheet and a cash flow statement? A balance sheet shows a company's financial position at a specific point in time, while a cash flow statement tracks how cash moves in and out of the business over a defined period. One is a snapshot; the other is a movie.
Can traders predict market crashes using financial statements? Financial statements don't guarantee predictions, but traders regularly identify warning signs such as rising leverage, deteriorating cash flow, or inflated asset values before major market corrections happen. The balance sheet won't tell you exactly when a collapse will occur, but it often tells you whether one is building.
Ready to put this knowledge to work? Start exploring global markets on BTCDana and apply real financial analysis to your trading decisions across forex, crypto, and CFDs, the way professional traders actually do it.