




What Is the Morning Star Pattern? Why It Is One of the Most Important Bullish Reversal Candlestick Patterns
A Morning Star is a three-candle bar signal that suggests a change from a downtrend to an uptrend, being formed at the bottom of the downtrend, with little chance of the price going lower than the lower candle. As the candlestick formation is a very strong reversal signal, this is one of the strongest signs that the market is moving from the bears back to the bulls, provided there is a potential for the candles to have entered consolidation.
This pattern can be equally effective when applied to different financial markets. You can use it to trade in stocks, Forex, Indices, CFDs, or cryptocurrencies. Its versatility in using the Morning Star pattern to identify market trend changes makes it an important tool for professional traders around the world.
The Morning Star does not guarantee that the direction of the market will continue upward; instead, it gives traders an indication of when the market is changing. It shows that as sentiment in the market is shifting from fear to hope, we have seen the point at which the downtrend has changed and the uptrend is coming.
When a trader sees the Morning Star, it tells them all is not well with the bears and that it appears the bulls will soon take control of the price action.
Morning Star Pattern Structure Explained: A Candle-by-Candle Breakdown
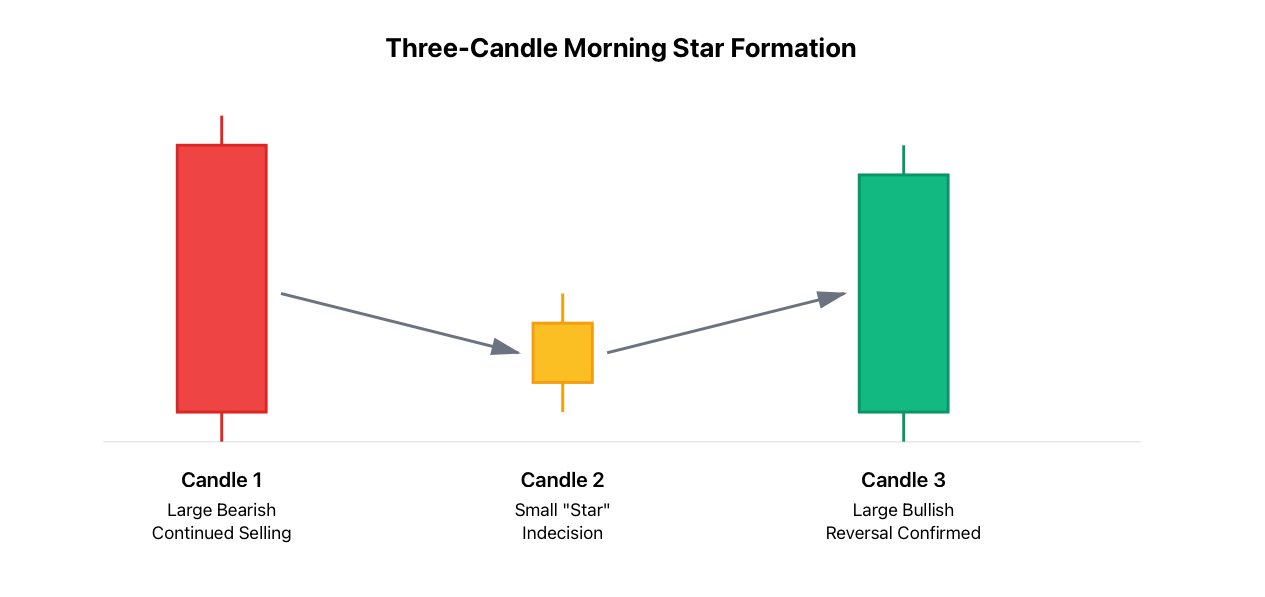
To recognise a morning star pattern, you will need to picture its three candlestick arrangement. Each of these three candlesticks describes the transformation of market participants toward bullishness.
The first of those three candles shows a significant amount of bearishness because of its large body. A bearish candle means that there is continued selling happening in the marketplace, and it tells us that the bearish sellers. They are still firmly in control. In addition to that, if this candle is long and drawn out, this indicates that the momentum will be much greater when it eventually reverses, and this will indicate to traders that they need to be much more cautious in taking any new positions.
Next in our morning star pattern is the candle, which has a small body, the "star," and gaps down from its prior location. This small-bodied candle, regardless of whether it is a doji or not, indicates that at that particular moment in time, there is indecision by both buyers and sellers, and both sides are fighting for control of the market. This means there is a high likelihood that this indecision will continue for the next several days, since both sides are reluctant to commit to either buying or selling further.
A strong upward current is reflected in the third candlestick, which closes deeply into the first candlestick's body. The closing price of the third candle clearly indicates that a reversal has occurred in the previous trend, as indicated by the successful buying activity of the third candlestick. The more deeply the third candlestick closes into the first candlestick's body, the greater the reversal signal.
Three candlesticks must be present for the pattern to be considered valid. If the third candle does not close into the first, then the morning star cannot be confirmed. Therefore, it is important to understand the structure of market action as a three-step process involving momentum slowing down due to buyers being outnumbered by sellers (the first candle), a shift in market sentiment (the second candle), followed by directional confirmation (the third candle).
To illustrate the analogy of the marathon runner, imagine finishing a race, taking a couple of minutes' rest, and starting to run in the opposite direction as soon as you are ready. Your first two candlesticks represent the slowdown and changes in market attitude (sentiment) as a result of the race, while the third candlestick represents a push forward (the runner) based upon the momentum gained during your initial race.
The Reason Morning Star Patterns Work: Sentiment Changes in the Market
The reason morning star patterns work is due to the way they indicate shifts in investor sentiment, specifically during trend reversals. By understanding how each of these market participants feels, we can better utilise this pattern in our trading.
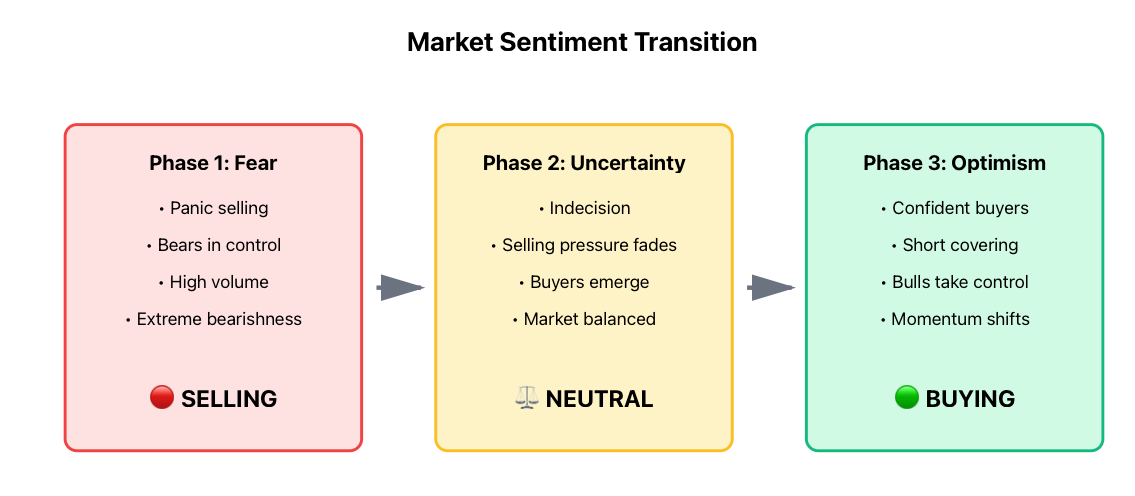
The initial phase (the large bearish candle) is characterised by "panic selling." This is when bearish traders are already in short positions and add to them out of panic, or when bullish traders (in the bullish trend) finally give in and sell their long position out of frustration. The combination of these two types of trader activity creates an extreme level of bearishness and drives prices down even further.
In the second phase (the small-bodied middle candle), we begin to see a shift toward indecision and/or uncertainty regarding the future direction of prices; therefore, selling pressure begins to fade away, while buyers start to emerge as they see an opportunity to buy at such a low price (due to the panic selling occurring). However, the actual reversal of price is still not confirmed by the market; there is still a waiting period for traders to wait for confirmation before purchasing (for a long position). Thus, the market remains in a state of being "balanced" during this period.
The third stage, characterised by the long bullish candle, is essentially a whipsaw of market sentiment. The influx of confident buyers into the market will usually cause sellers to cover their shorts; they must close their positions because of the increased buying pressure that exceeds all other available resources for selling. This new influx of buying pressure eventually overwhelms any remaining sellers and forces prices much higher.
This psychological transition has occurred in all markets because markets are created by the emotions of human fear and greed. The morning star is an excellent representation of that reversal point from fear (during the downtrend) to uncertainty at the low point to optimism during the reversal.
Traders who are professionals understand that this pattern indicates a change in the underlying fundamental sentiment within the market rather than simply a visual price formation. Think of it as experiencing the greatest amount of anxiety before an examination, only to later learn that the questions are easily manageable with a sense of renewed respect after successfully answering them all.
Morning Star Pattern vs Other Bullish Reversal Candlestick Patterns
The morning star pattern is a strong signal, but it is not the only bullish reversal pattern when performing candlestick analysis. It is important to understand every bullish reversal’s similar appearance and ability to avoid misidentification and aid in selecting the appropriate tool for different types of market conditions.
The bullish engulfing pattern is very easy to understand because it consists of only two candles, during which the second candle's body appears to completely engulf the first candle.
In contrast to the morning star's three-candle structure that represents a gradual transition of market sentiment, the bullish engulfing pattern displays an immediate change in market sentiment. In both patterns, there is pressure to buy; however, with the morning star, a buyer has much more information regarding market sentiment flowing into the third candle than he does with the bullish engulfing pattern.
A hammer is a one-candle reversal signal created at the bottom of a downtrend. A hammer has a small body at the top with a long lower shadow, indicating that buyers have begun to purchase shares after sellers have pushed prices lower. Hammers are a good signal, but hammers do not guarantee the same kind of confirmation as the third candle in a morning star.
The morning star is considered to be more complex than either the bullish engulfing pattern or the hammer pattern because it requires one additional component, but this does not necessarily make the morning star more advantageous. Each pattern has its advantages based on the type of market condition.
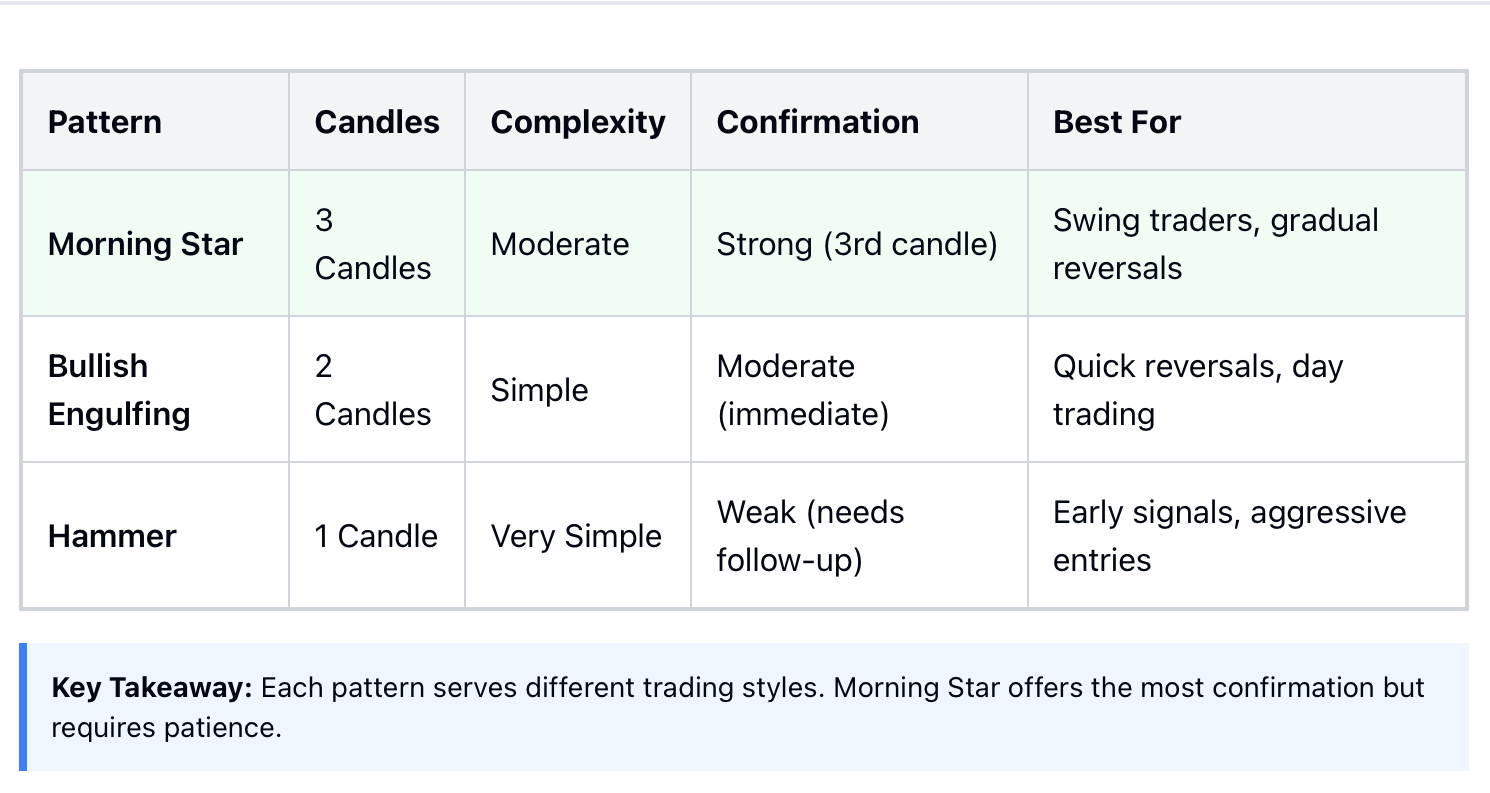
As a newcomer to trading, you may find that the Morning Star pattern is a little harder to identify correctly because it has three candles that form the pattern. Having the third candle, which provides you with extra confirmation that your entry will be profitable, makes this pattern more reliable when you trade correctly.
You can consider these types of patterns similar to how vehicles use various forms of brake systems to stop or change direction. While they all accomplish similar goals, they do so through completely different means and may have value at different times. The important takeaway from these patterns is that you need to be familiar with the different ways in which they work rather than declaring one as the best.
How to Trade the Morning Star Pattern in Forex, Stocks, CFDs, and Crypto Markets
The morning star pattern can be adapted to most financial markets due to its great utility and value. Though generally applicable to all financial markets, there are important details of how to interpret and trade the morning star pattern based on the relative liquidity, volatility, and trending characteristics of the market you are focusing on at any given time.
In the currency market, for example, the high level of liquidity enables traders to be less concerned with false signals when spotting a morning star. The 24-hour trading of currencies also provides many opportunities throughout the many trading sessions to look for the morning star formation. However, because currency markets experience long periods of range-bound price activity, it is critical to determine the dominant trend prior to attempting to spot a reversal pattern.
When trading stocks, the morning star formation is usually a great reversal indicator for stocks with good fundamentals that have become temporarily out of price. The trend structure of stock markets is usually much clearer and defined than other financial markets, which assists in spotting valid morning star patterns after the end of a downtrend.
Using index CFDs as a vehicle to trade the morning star pattern can also be very successful. Index CFDs will generally reflect a smoother trend structure and lower volatility than stocks, which makes finding and identifying a morning star formation easier than traditional stocks. The removal of the noise of individual stocks from the broader market provides more meaning to the patterns found in the index, as opposed to individual stocks.
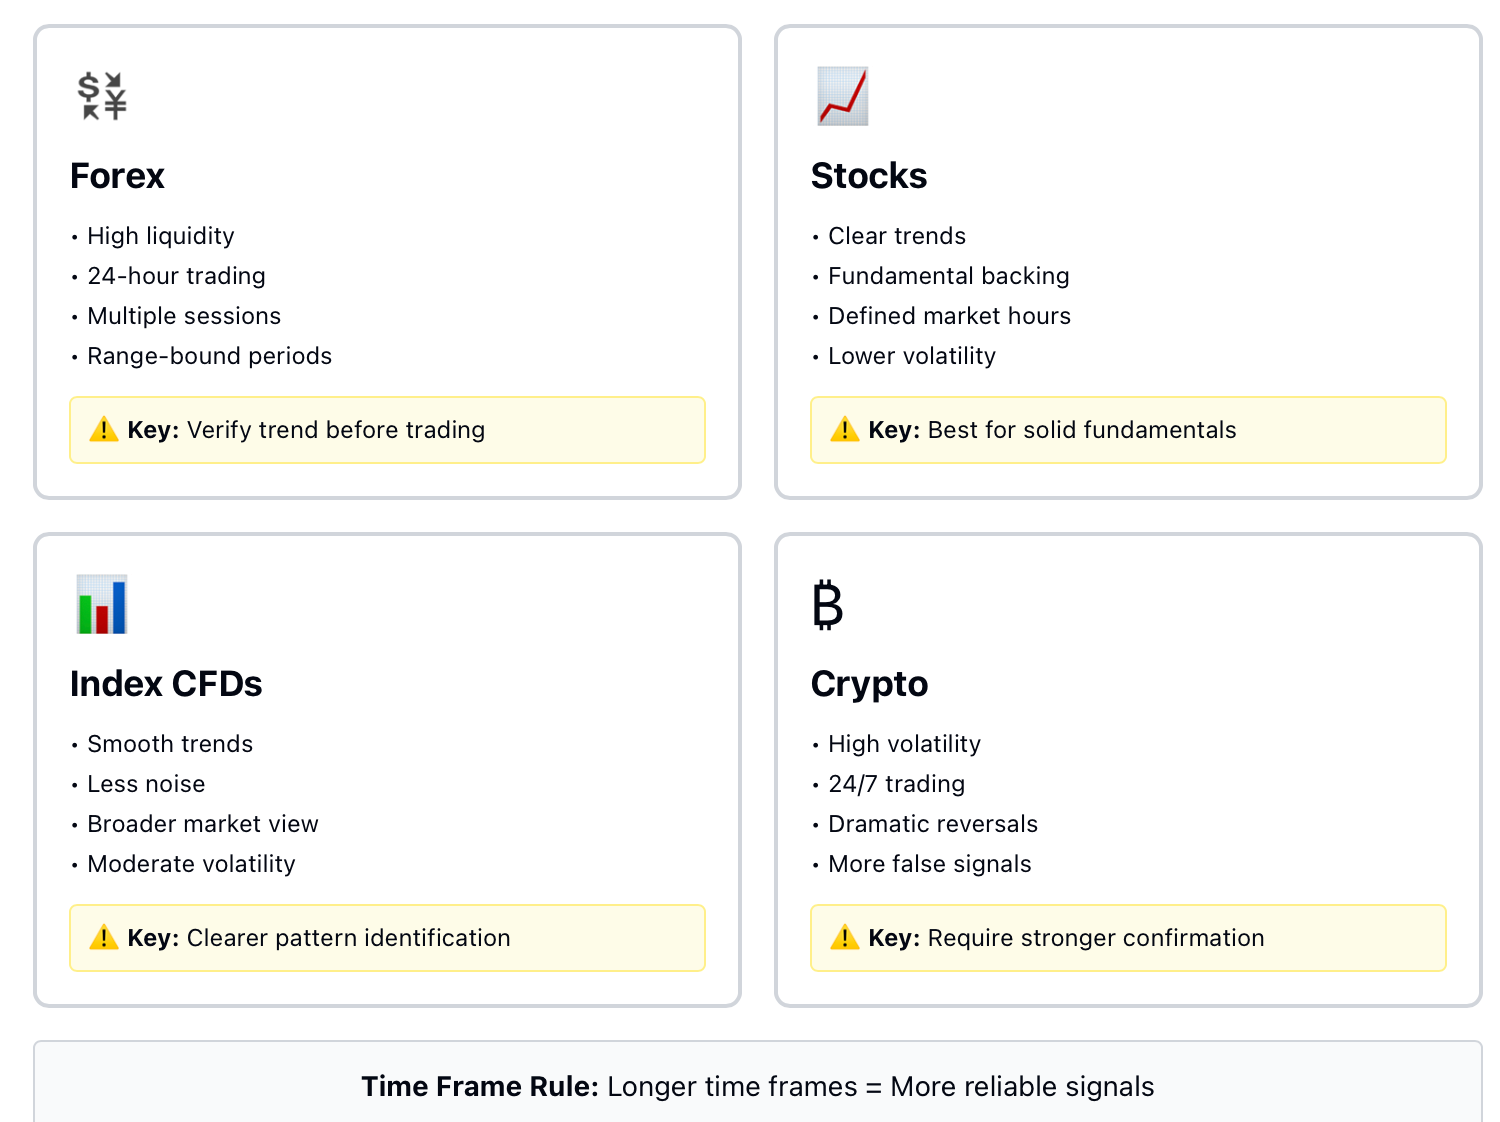
Traders using the morning star pattern and other trading systems can take advantage of the high level of volatility found in Cryptocurrencies. Although the degree of volatility increases the chances for dramatic reversals, many traders will experience more false signals due to increased volatility in the cryptocurrency trading space. Therefore, the confirmation required when trading a morning star pattern in the cryptocurrency market may be higher than when trading the same pattern on other securities.
The morning star is a reversal pattern that shows market reversals. Generally, the longer the time frame, the more reliable/accurate the morning star reversal pattern. For instance, a daily chart represents more of a majority decision among market participants than a 5-minute chart. This is because, as time goes by, the majority of the participants will have made their decision, and there will be less noise in the prices due to time and experience, and added volume from people participating at that time.
In essence, traffic laws apply to every country in the world, but varying local conditions may require differing interpretations or adaptations to traffic laws. Likewise, the same morning star reversal pattern can be observed across the vast array of global financial markets, but successful traders adapt their approach to the various nuances of the individual markets they participate in.
Morning Star Pattern Confirmation Signals: How to Filter Out False Setups
The Morning Star candlestick formation has the potential to produce high-probability reversals. However, not all Morning Stars result in successful reversals. You can improve the probability of success with this candlestick formation by using confirmation tools.
One method to improve your success rate using the Morning Star candlestick formation is to use volume confirmation. An ideal Morning Star formation will have a decrease in volume for the second candle of the formation (indicating seller exhaustion), followed by an increase in volume for the third bullish candle (indicating new buyer interest). This volume confirmation validates the sentiment shift created by the Morning Star candlestick formation.
Another method to validate your Morning Star candlestick formations is to identify the significant support levels. Morning Star formations found at significant support levels (e.g., prior resistance level now becoming a support level, moving averages, Fibonacci retracement) are much more powerful than Morning Star formations located at non-significant support levels. The support area can act as a "floor" where the buyers will probably enter, thus increasing the chance of successfully reversing.
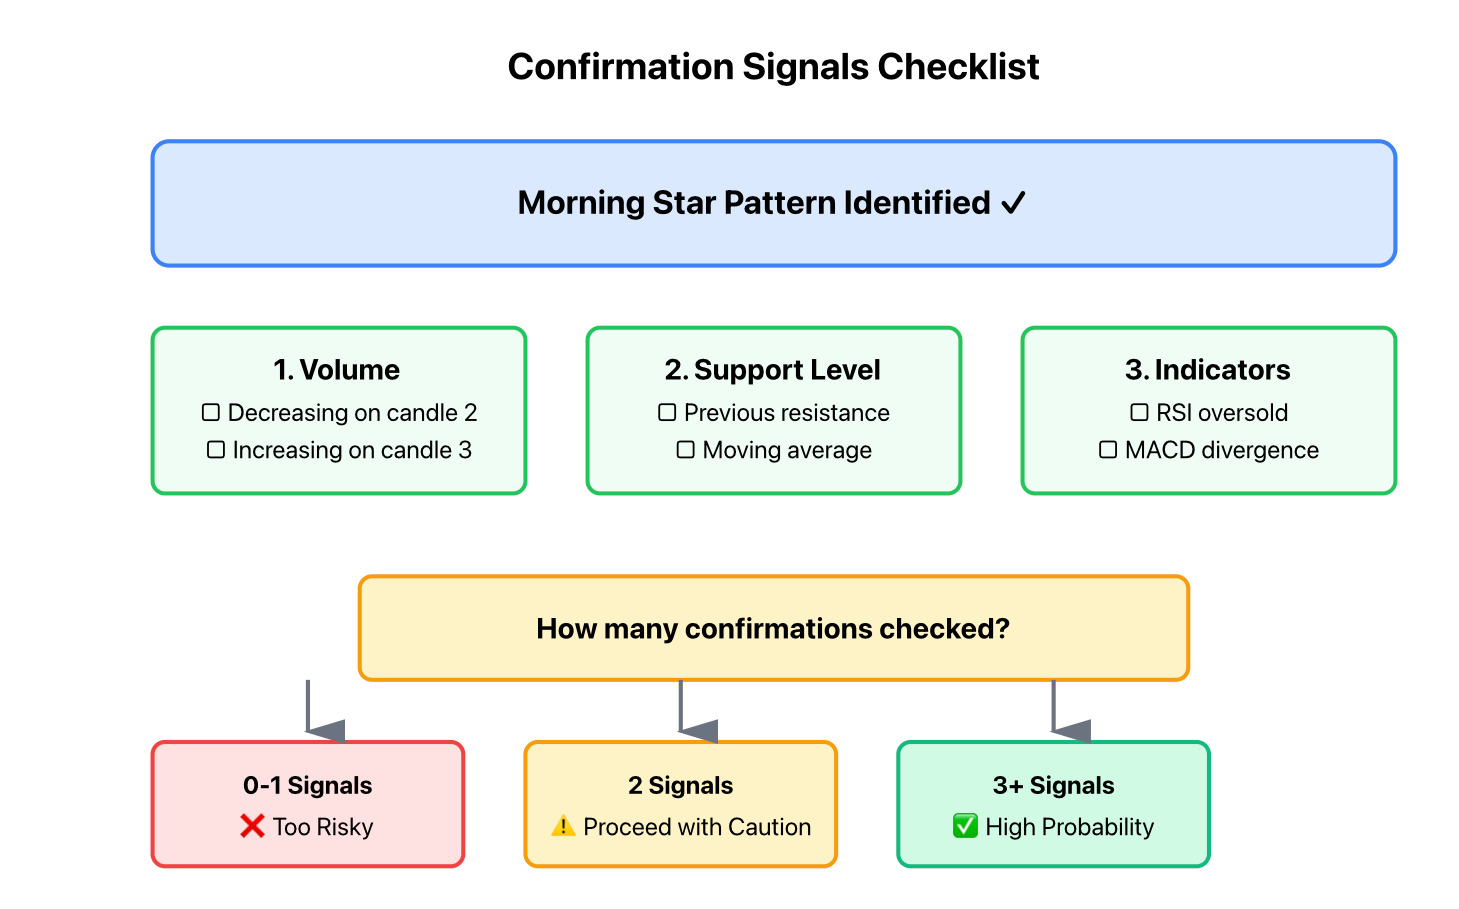
You can also improve your Morning Star formations using technical indicators like RSI and MACD. When identifying a Morning Star candlestick formation, ensure you also see oversold conditions on the RSI or bullish divergence formations on the MACD indicators. These confirm that momentum is beginning to shift in your favour, adding to the bullish confirmation provided by the Morning Star candlestick formation.
The reasoning for why multiple confirmation signals should be used is that if several different types of analysis show the same conclusion, the signal is seen to be a more dependable signal. In comparison, if you hear the same story from several different friends, it gives you more confidence in the information because multiple sources indicate the same conclusion.
Confirmation signals are often more significant than the pattern alone; for example, a perfectly-shaped Morning Star pattern without any other supporting evidence is less strong than an imperfectly-shaped Morning Star formation that is accompanied by strong confirmation, via volume, support levels, and indicators.
When combining multiple confirmation signals, attempt to minimise the risk of "analysis paralysis" by ensuring you are focusing on the most relevant confirmations for your individual trading style and time frame. A Swing Trader will likely prioritise different confirmations when filtering for Morning Star Set-ups as opposed to a Day Trader, but use the same methodology of using multiple confirmations for filtering Morning Star Set-ups.
Mistakes made by traders when identifying and trading the Morning Star Pattern: The five most common errors
Even the most experienced traders make mistakes by incorrectly identifying the Morning Star Pattern and/or trading it improperly. Knowing which errors you could make will hopefully help you avoid these costly errors and improve your profit potential with this candlestick pattern.
One of the most common errors traders make is using the Morning Star Pattern in sideways/choppy markets. The Morning Star Pattern is only useful for identifying potential reversals at the end of a downtrend, not for predicting future movements during a period when prices are stuck in a range. Therefore, when a trader is using the Morning Star Pattern incorrectly, they are forcing a pattern that is not relevant to the current market situation.
Another common thing traders do is to ignore higher time frame trends when analysing a smaller time frame chart. The 15-minute candle may seem like a perfect example of a Morning Star Pattern, but if there is a strong downward trend on the daily and/or weekly candle chart, it is less likely that this reversal pattern will be a successful trade. Be sure to take into account the overall trend before taking a trade based on a smaller candle chart.
Another common mistake traders make is entering trades too soon. Many traders start trading as soon as they see that the middle candle in the chart pattern has completed, even though they should have waited for confirmation with the third candle. Trading before the signal has flashed is similar to driving through the intersection when the light is still red. It may work sometimes, but it usually creates more risk than if the traveller were patient.
Many traders also do not understand how to utilise the pattern of multiple candles. Many use the pattern as a basis for entering trades without using the proper risk management tools, like using a stop-loss order or assessing the amount of profit they can potentially receive against the amount of risk they would incur if the trade fails. Using the candle pattern in this way turns it into a form of gambling.
Some traders become overly rigid in how they identify the candle pattern. They may disregard any valid candle formation, feeling it doesn't fit, because the middle candle was not a perfect doji (a doji is a candle that closed at the same price it opened), or the candle did not exactly close at the price they thought it should. While knowing how to identify correctly is paramount, it is important to be flexible in recognising what is meant by the 'essence' of the correct pattern rather than being solely focused on adhering to strict textbooks.
By avoiding these mistakes, you can incorporate this powerful tool into your trading arsenal without falling prey to the same pitfalls as most traders.
The Morning Star Trading Strategy and Risk Management Complete Execution Framework
To convert a simple observation of the Morning Star Pattern into a profitable trading strategy, traders must develop a complete Execution Framework for implementing their strategy. This Framework must consist of specific Entry Rules, Stop-Loss Locations, and Profit Targets (the three major building blocks of successful Candlestick Trading).
In developing Entry Logic, traders must ensure that their logic is both Simple (easy to understand) and Precise (as precise as possible). The most appropriate time to enter a trade using a Morning Star Pattern is after the third Candle of the Pattern has completed its formation and closed; this indicates that a Price Reversal has taken place.
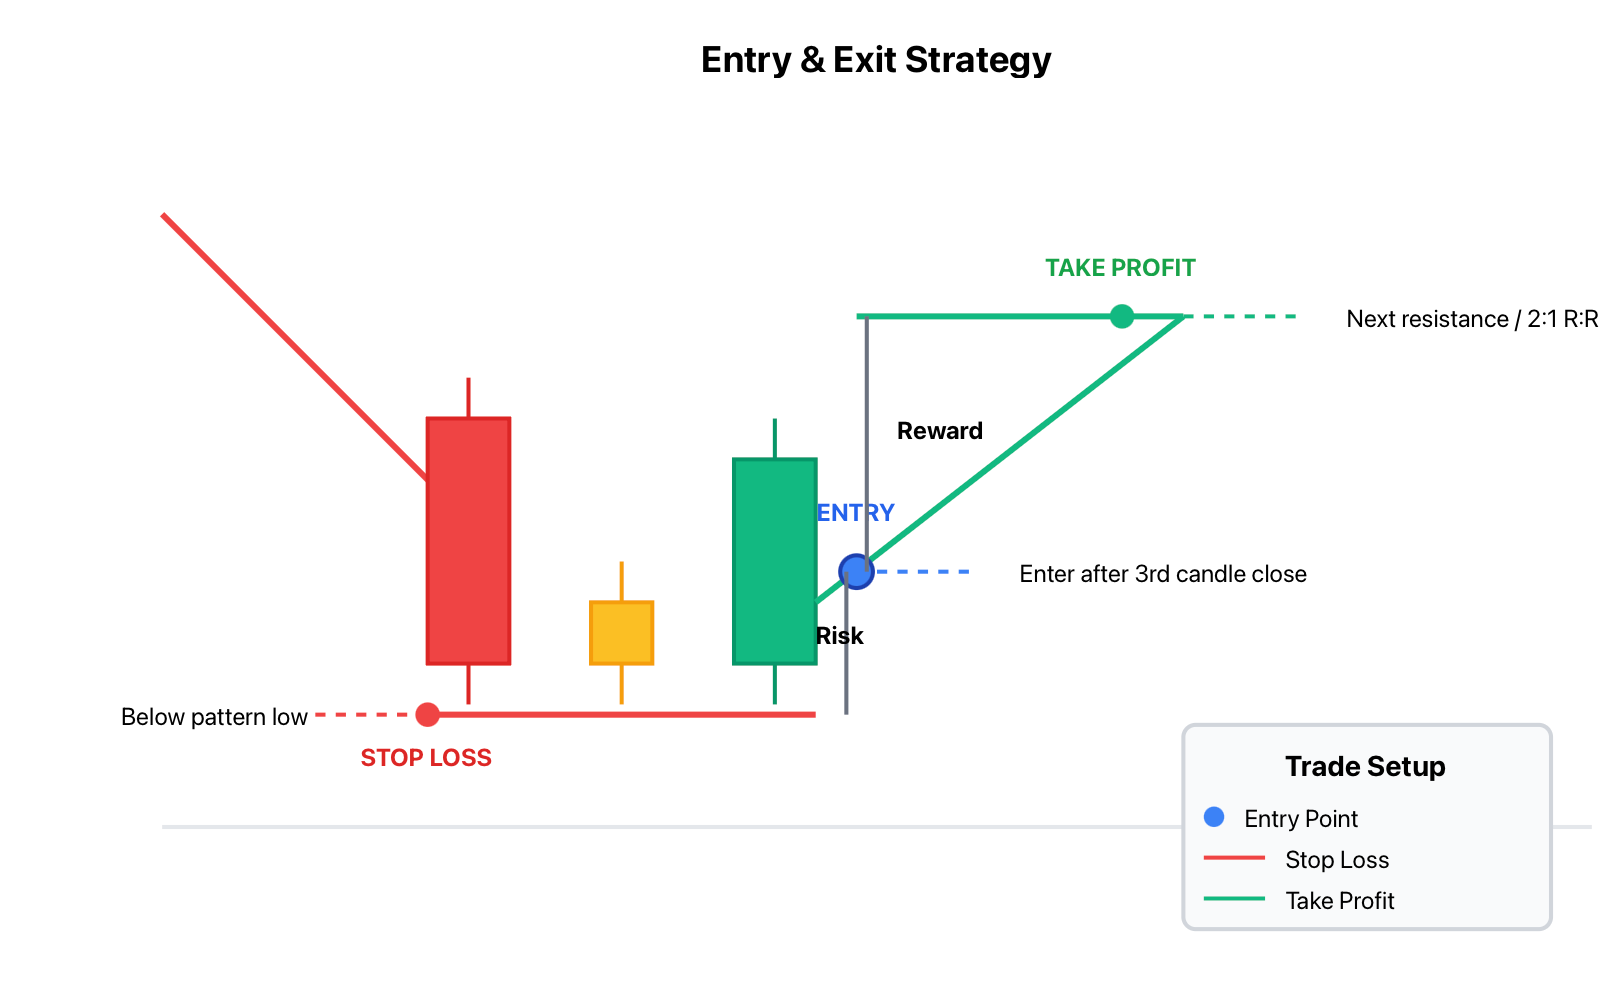
Many traders may choose to wait for a Minor Pullback/Consolidation after the third Candle closes before entering a position to achieve better Entry Prices. Other traders may choose to immediately enter a trade at the Close of the third Candle of a Morning Star Pattern. Both types of traders can be successful as long as their Trading Strategies have Consistent Execution.
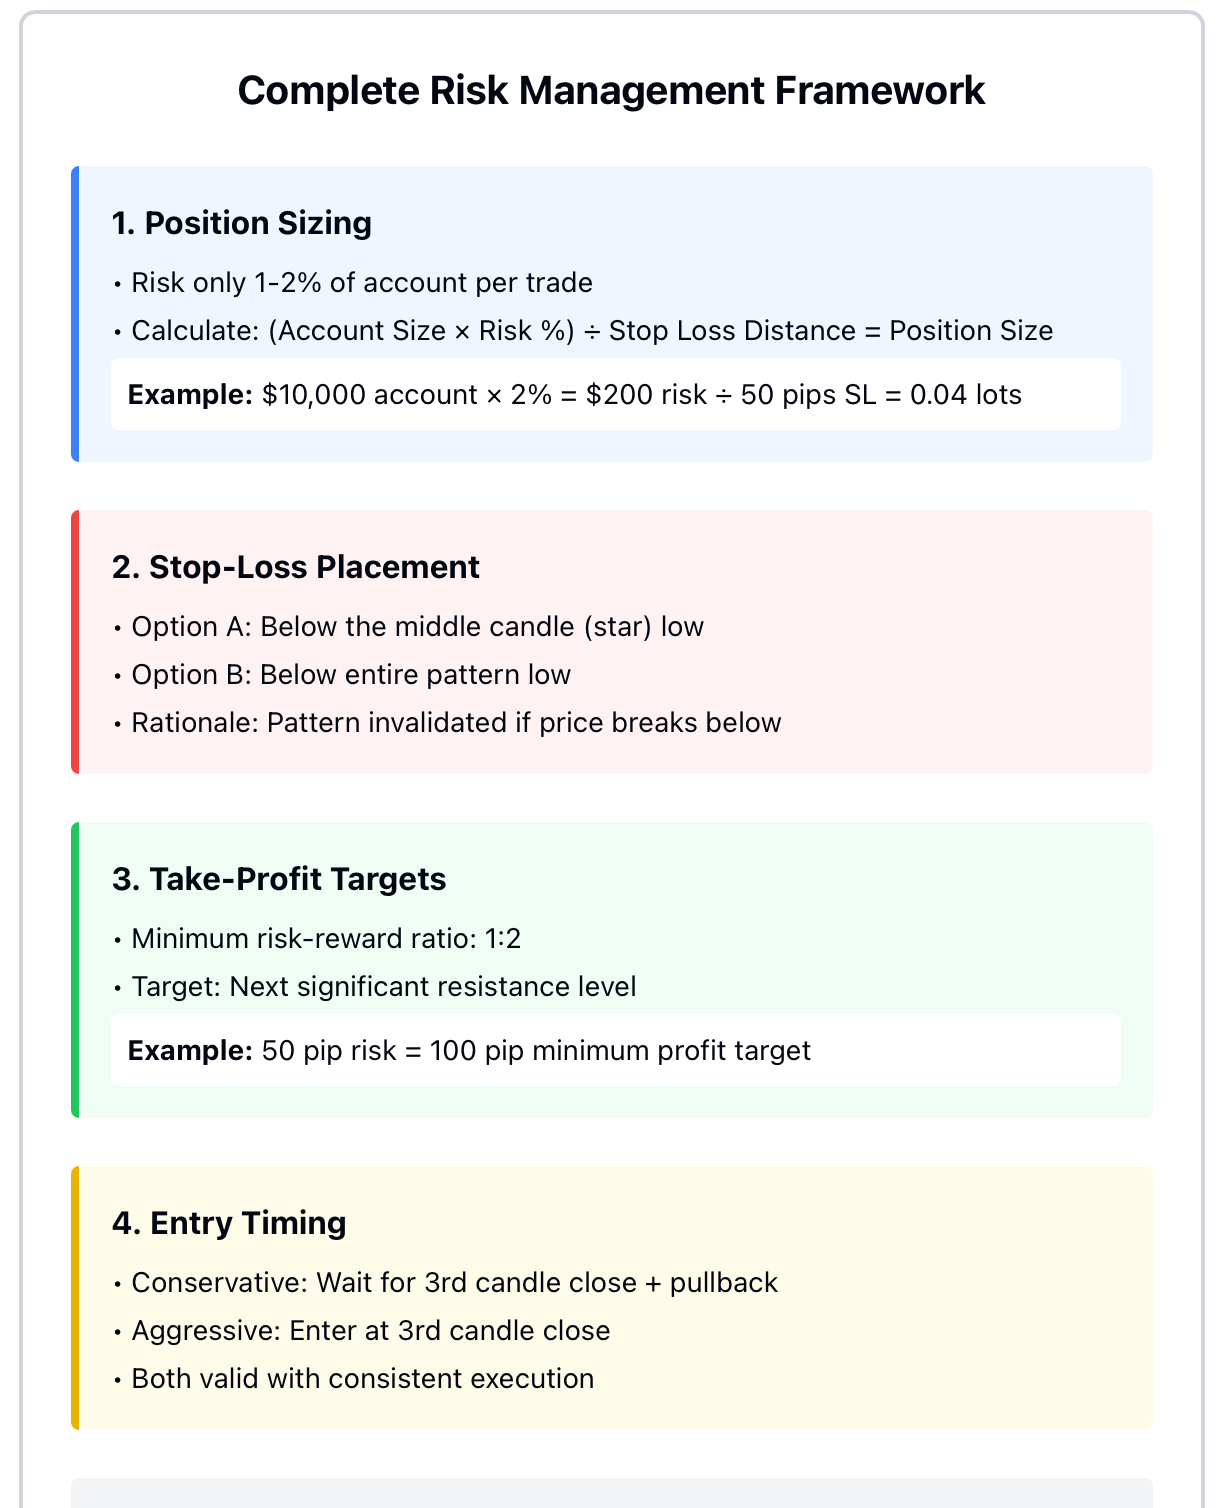
Critical to Trading Successfully Using the Morning Star Pattern is having a Defined Location to place your Stop-Loss; this is how traders manage Risk in trading activity. The most common location for placing a Stop-Loss is directly below the Low of the Middle Candle (the Star) or below the Low of the entire Morning Star Pattern itself (the Bottom of the Pattern). The rationale behind Stop-Loss placement is that if the Price trades into or below the Stop-Loss Level, the structure of the Morning Star Pattern has been invalidated.
While selecting take-profit targets, you could choose the next significant resistance level that would be expected to stop the upward movement of price, or you might want to follow a fixed risk-to-reward ratio that is at least 1:2. If your stop-loss is set to 50 pips below your entry price point, then you should have a minimum take-profit target of 100 pips above your entry price point so that your positive risk-to-reward ratio will ensure profitability for even those traders who have a relatively low win rate.
Another essential aspect of risk management is the ability to size positions appropriately. Many day-traders follow the rule of only risking 1% to 2% of the entire trading account balance on one single day-trade. This would mean that for those day-traders who are using a larger stop-loss, it is necessary to lower the size of their position, so they can continue to maintain the same level of risk.
Successful long-term profitability will be achieved through proper risk management and not from the pattern of trading itself. The morning star is only an indicator for making trades; therefore, you will be successful if you utilise the resource correctly by implementing risk management.
Risk management should be considered similar to the use of a seatbelt; while it will not eliminate all accidents from happening, it will lower the amount of damage sustained from an accident.
Using the morning star pattern in conjunction with this structure of risk management will create a complete trading system that is capable of producing the same results over time consistently.
As the morning star pattern can provide many benefits to various types of traders, knowing which trader profile will benefit most helps determine whether or not you should include it in your trading toolkit. The following outlines the types of trader profiles and what traders may be most successful using the Morning Star pattern.
For beginners, the morning star pattern is beneficial because it features a very recognisable visual structure and built-in confirmation. Unlike many of the other technical indicators that can be quite complicated, the morning star pattern represents an easy-to-follow transition from bearish to bullish market emotion. As the morning star consists of three different candles, it allows for a gradual learning curve for beginner traders learning how to use technical analysis.
The best profile of a trader using the morning star pattern is a swing trader. Swing trading is characterised by intermediate-term price action, generally lasting anywhere from days to weeks. The reversal signals generated from morning stars fall directly into a swing trader's window of opportunity to enter trades at or close to the beginning of an emerging uptrend and hold that trade for potentially significant profit.
Who Should Use the Morning Star Pattern? Trader Profiles and Use Cases
As the morning star pattern can provide many benefits to various types of traders, knowing which trader profile will benefit most helps determine whether or not you should include it in your trading toolkit. The following outlines the types of trader profiles and what traders may be most successful using the Morning Star pattern.
For beginners, the morning star pattern is beneficial because it features a very recognisable visual structure and built-in confirmation. Unlike many of the other technical indicators that can be quite complicated, the morning star pattern represents an easy-to-follow transition from bearish to bullish market emotion. As the morning star consists of three different candles, it allows for a gradual learning curve for beginner traders learning how to use technical analysis.
The best profile of a trader using the morning star pattern is a swing trader. Swing trading is characterised by intermediate-term price action, generally lasting anywhere from days to weeks. The reversal signals generated from morning stars fall directly into a swing trader's window of opportunity to enter trades at or close to the beginning of an emerging uptrend and hold that trade for potentially significant profit.
BTCDana is an excellent platform to utilise this candlestick pattern on several different asset classes with the correct tools and functionalities.
The transition from learning to being a successful trader will start with just observing the Morning Star Pattern. You will be able to actively watch a variety of other markets on the BTCDana platform and identify the Morning Star Patterns via advanced charting tools. Additionally, the multi-timeframe analysis capability allows you to identify Morning Star Patterns across the various time frames, and this capability will give you a better understanding of which patterns are most likely to produce reliable trades.
After identifying possible Morning Star Patterns, you can use the demo account to practice your trading without risking any of your own money. The demo (paper) trading platform is an excellent way to improve your pattern recognition skills and develop an understanding of different confirmation techniques until you are consistently successful at making a profit.
When you feel confident enough to begin to take live trades, you will experience all of the benefits offered by BTCDana, such as the ability to access multiple assets and apply the Morning Star pattern along with the trader to an account that has access to Forex, indices, commodities, and cryptocurrency from one intermediary. The availability of multiple asset classes means you can find the best trades regardless of what the overall market condition is.
BTCDana gives you the option to use CFD on both sides: being able to trade the long side as well as the short side is beneficial during the reversal pattern, such as the morning star. Essentially, when you enter into a new long position after a confirmation of the morning star formation at that price level, you don't have to worry about borrowing shares from another account or having other issues like those you would normally encounter with stock trading in the traditional sense.
BTCDana has an additional benefit over most platforms because of the available risk management tools. The platform has built-in order types such as the "stop-loss" and "take-profit" orders, to easily apply the same principles discussed throughout this article. The position size calculator also assists you in maintaining a consistent level of risk across all transactions.
One must realise that trading is an ongoing journey of continued education and adaptation. You can begin your journey with the knowledge gained from the morning star pattern, but be prepared to expand your knowledge as time goes on. BTCDana's educational and community aspects will assist you during the educational process.
Would you like to utilise the knowledge from the above paragraph regarding the morning star? If so, sign up for an account with BTCDana and use that information consistently as you trade in real market conditions.