



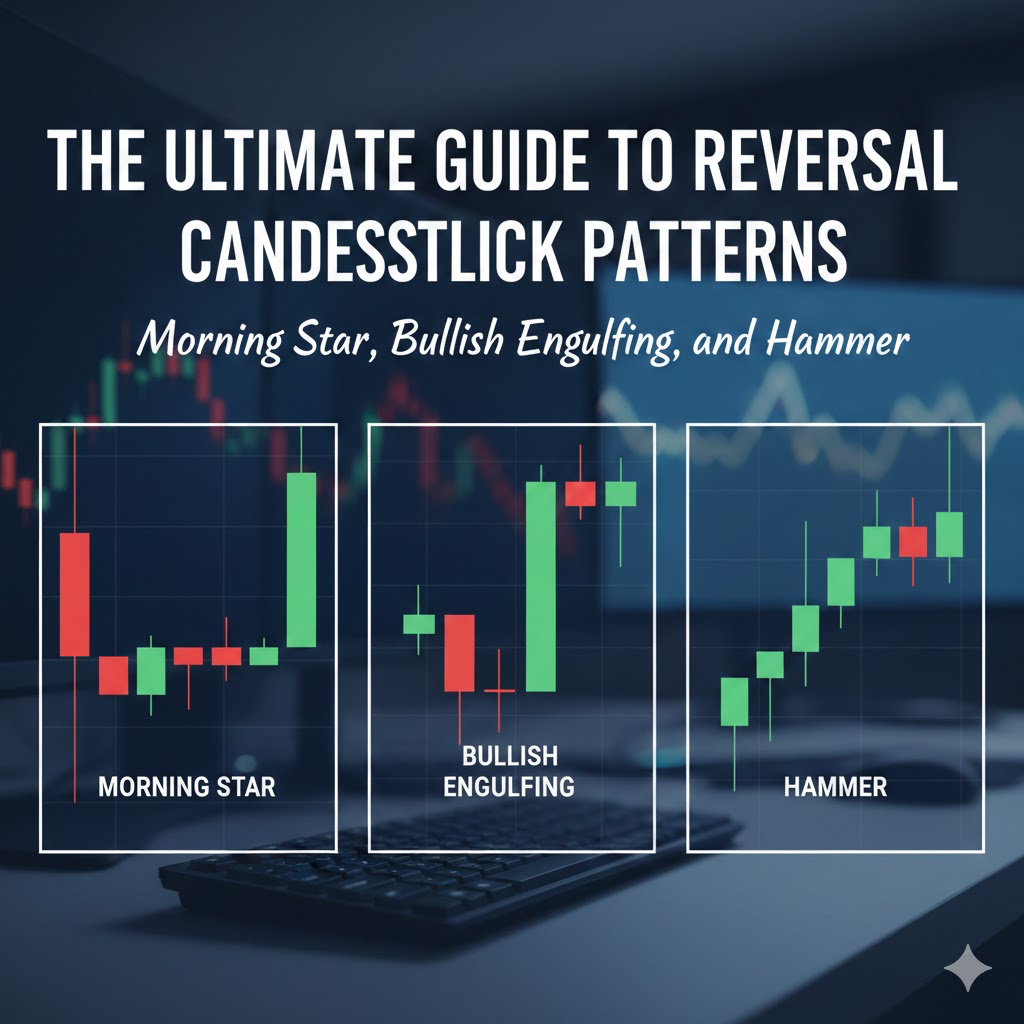
The Importance of Candlestick Reversal Patterns for Traders
The use of candlestick reversal patterns is an essential component of a trader's ability to conduct technical analysis on the markets. Candlestick patterns provide traders with an immediate visual reference of price movement and market sentiment; therefore, reversal candlestick patterns act as the initial warning signs of a potential change in the direction of the trend, just as heavy storm clouds indicate an approaching storm.
A trader may view reversal candlestick patterns as nature's way of offering clues about future market movement. For instance, traders often watch for reversal patterns before a major shift in the direction of a trend, similar to how birds migrate south in the fall as the weather changes for winter. The reversal candlestick pattern will give the trader important signals as to when the sellers, or bears, are losing control and the buyers, or bulls, are gaining control.
In this guide, we will evaluate and interpret three different types of reversal candlestick patterns that traders from around the globe utilise to determine potential trend reversals.
They include the Morning Star pattern: a bullish reversal pattern.
Bullish Engulfing: a strong reversal pattern.
Hammer: a bottom reversal.
Based on the reliability of the individual patterns, their advantages, disadvantages, and their effectiveness in different global markets, including EUR/USD, Gold (XAU/USD), and BTC/USD.
The use of reversal candlestick patterns is not a standalone method for picking market entry points, as reversal patterns should always be employed with consideration of other technical analysis tools (trend structure, volume) and in the context of an overall trading plan that combines these elements with price movement.
Understanding Why a Trend is Important in Trading
Before exploring specific reversal candlestick patterns, we need to examine the value of the context surrounding them. While a trader may learn candlestick reversal patterns, he or she is likely to be unsuccessful in executing trades based on these candlestick patterns if he or she does not take into account the broader market trend structure.
The direction in which a market is moving is referred to as a trend:
-
Uptrend - Higher highs and higher lows
-
Downtrend - Lower highs and lower lows
The strength of a trend at the time a reversal pattern forms determines whether the reversal signal will ultimately be successful. A good analogy would be that a speeding vehicle does not stop just because a leaf is in the roadway. Likewise, small-sized reversal patterns usually do not have enough size or momentum to reverse a major trend.
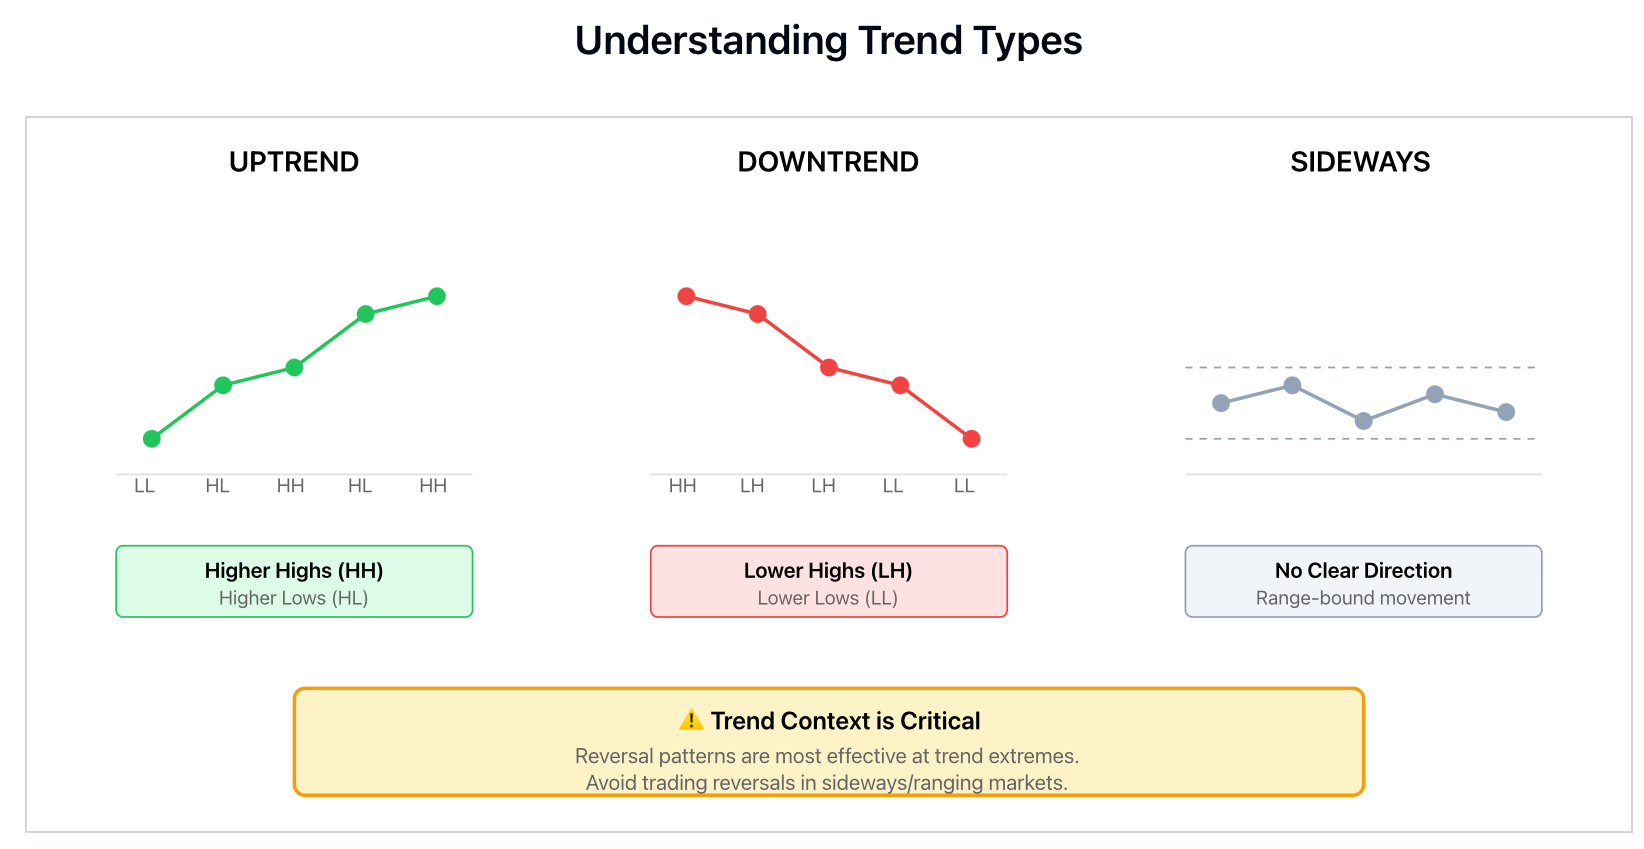
For example, a perfect hammer can form in a strong uptrend on the NAS100 4H time frame, and the price will continue to move upward due to the underlying strength of momentum was far too great for the hammer pattern to reverse.
Always evaluate the current trend before assessing any reversal pattern.
Ask yourself the following questions:
-
Is the current trend strong or showing signs of weakening?
-
Are we approaching a major level of support or resistance?
-
Has there been a recent liquidity sweep?
Many traders mistakenly apply the same significance to every pattern regardless of market conditions. For example, gold will frequently create false reversal signals when it is in an uptrend because inexperienced traders will become trapped by these false signals.
It is important to remember this principle - trend strength usually outweighs a reversal candlestick’s strength. A less-than-perfect pattern that occurs in an area of a market that is moving downward with weakness will outperform a perfect pattern that occurs in an upward-moving market.
Morning Star Pattern: The Classic Three-Candle Bullish Reversal
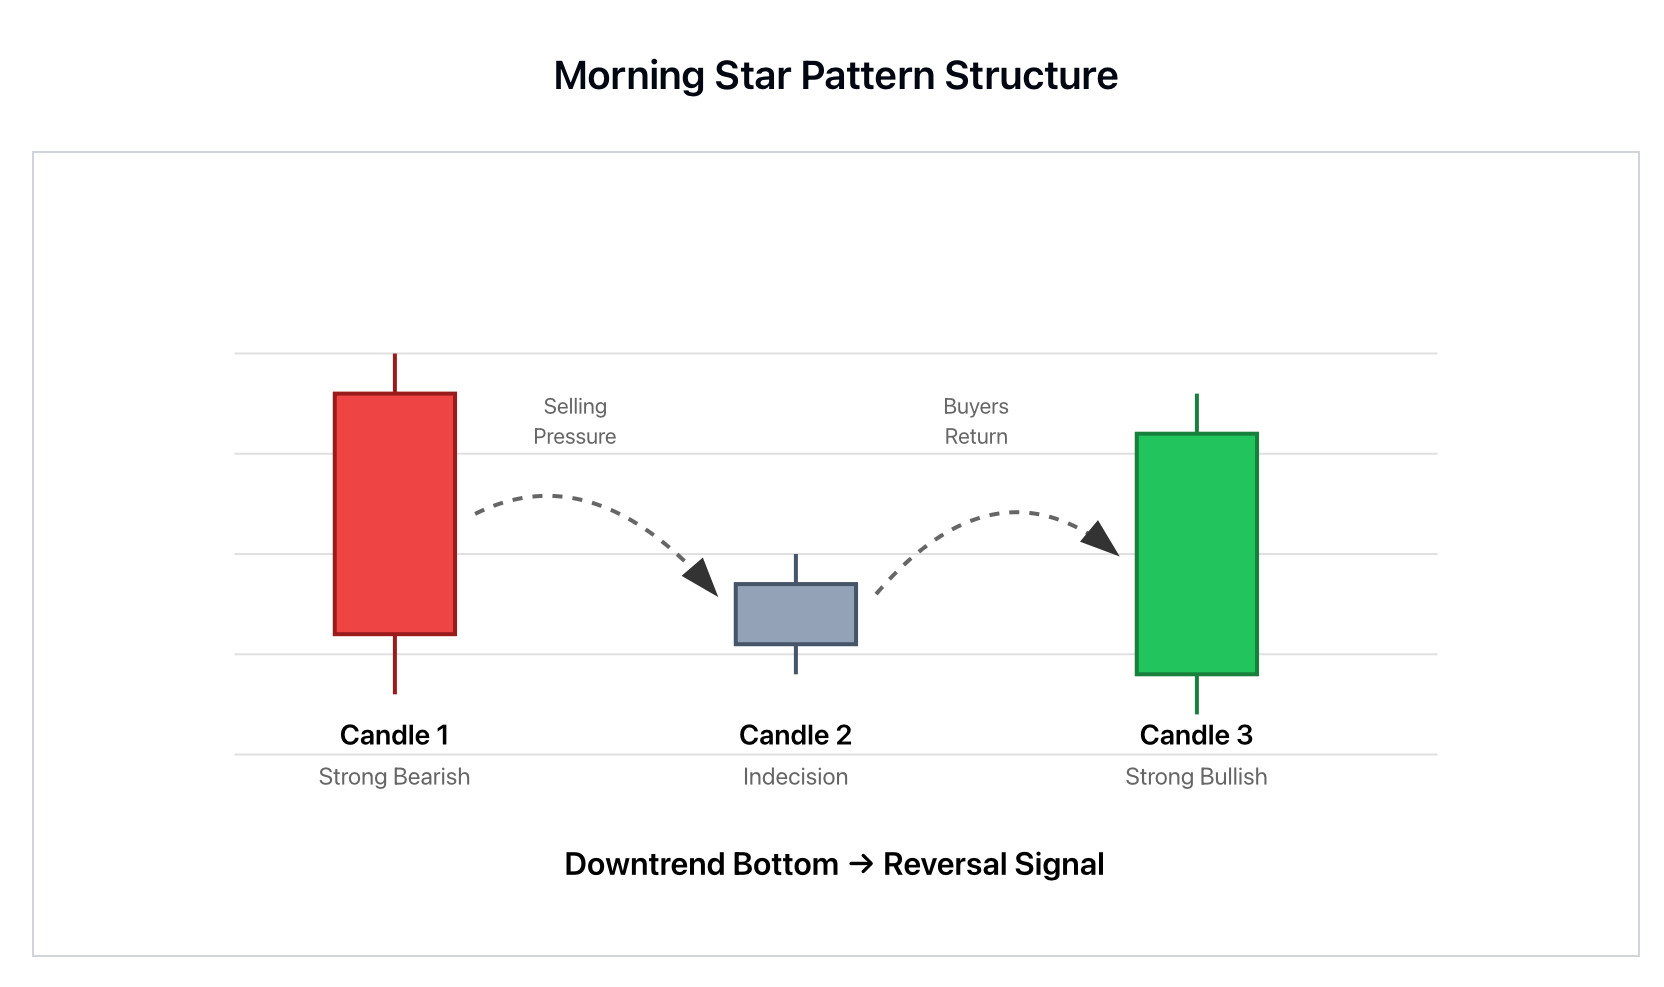
The Morning Star pattern is one of the strongest, most trusted bullish reversal patterns in the realm of Technical Analysis. A series of three candlesticks collectively represents the change in market sentiment from complete bearish control to full bullish control.
Here is how the structure appears:
1. First Candle - Long, strong red bearish candle indicating substantial bearish selling pressure
2. Second Candle - Very small-bodied candle (Doji or tiny candle) indicating the market's indecision
3. Third Candle - Long Green bullish candle showing that buyers have returned.
As an example, consider exam scores; when you initially get low scores, you eventually level off, and the trend in your score will go up over time, demonstrating improvement in your performance. The market transitions from panic selling → uncertainty→confidence to buy.
The BTC/USD 4-hour chart is a perfect example of a real-world Morning Star pattern in play. After a very long period of downtrending, the pattern appeared and produced a 3% bounce in subsequent sessions. One of the keys was that the pattern broke out at a very important support level with increased volume on the third candle.
To increase the reliability of this type of bullish reversal, look for the following criteria:
-
The Morning Star Pattern must be forming at or near the bottom of the downward trend.
-
Volume on the third candle should be very high because higher volume indicates higher reliability.
-
Ideally, the third candle should close above the halfway point of the first candle.
When identifying false signals, be aware of:
- The second candle doesn't represent indecision
- It appears in a sideways market, not a trend bottom
- Volume does not confirm the pattern
The closer the Morning Star pattern comes to "textbook" structure, the greater the odds for a reversal. So, to increase your chances of success, make certain that you honour all five structural parts and use other technical analysis tools to confirm your entry into trades.
Bullish Engulfing: The most powerful of the reversal patterns
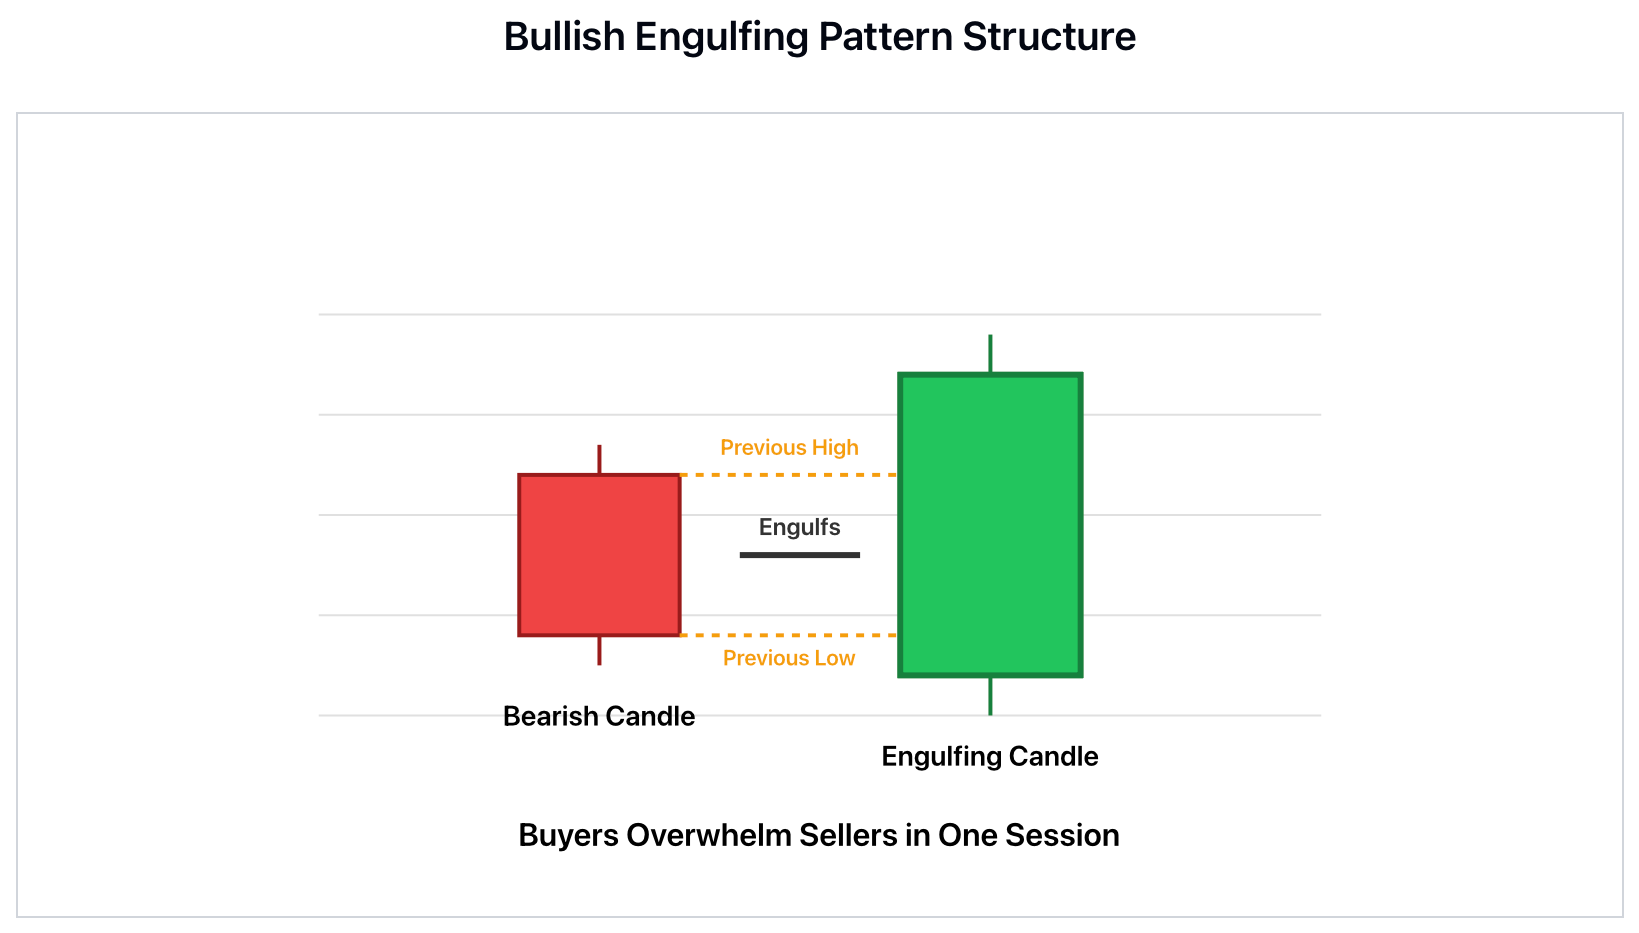
The Bullish Engulfing pattern is one of the most dramatic-looking reversal candlestick patterns. It is one of the most powerful because it clearly illustrates the ability of buyers to dominate sellers in a single decisive action.
The Bullish Engulfing pattern is straightforward to spot; the second (bullish) candle is entirely larger than the body of the first (bearish) candle. This indicates that buyers have instantly gained control from sellers with such effectiveness that they have effectively wiped out all the previous session's losses. Take the example of a runner trailing another runner: the trailing runner suddenly sprints ahead of the one in front. It is evident that the market sentiment has shifted significantly during one session, and it often catches many traders off guard.
The Bullish Engulfing Candle pattern develops after the release of the Nonfarm Payroll report on XAU/USD, resulting in a significant uptick (+$30) in value over several trades. Additionally, this Bullish Engulfing Candle formed at a very strong Support level, which resulted in many Stop Orders being wiped out.
There are many advantages to the Bullish Engulfing Candle:
-
The Bullish Engulfing Candle is simple for traders to spot
-
It's one of the most commonly seen patterns among all market participants
-
The Bullish Engulfing Candle is a clear visual sign of increasing buying momentum
However, there are also some disadvantages associated with the Bullish Engulfing Candle pattern:
-
There is a very high level of false signals from the Bullish Engulfing Candle pattern during consolidation or ranges.
-
Major institutional traders are often able to manipulate this pattern to create false signals.
-
The Bullish Engulfing Candle pattern requires confirmation through continued price action after the Bullish Engulfing Candle pattern forms.
To provide better confidence in these trades, traders should consider these guidelines when trading the Bullish Engulfing Candle:
-
Trade this pattern in conjunction with identified Support and Resistance levels.
-
Look for a Bullish Engulfing Candle with a large body and high volume for greater reliability.
-
Use other indicators or signs of price action to confirm the Bullish Engulfing Candle pattern.
-
Wait for the Bullish Engulfing Candle pattern to form at the conclusion of a downward trend on a weekly chart.
It is very important to understand that the Bullish Engulfing Candle pattern is only valid and has a high probability of providing “real” trading opportunities if it forms in relation to a major level of Support or Resistance. If the context of the event that produced the Bullish Engulfing Candle pattern is not situated or placed in a proper context, the Bullish Engulfing Candle pattern may not provide a viable opportunity and may ultimately result in significant loss.
Hammer: The Single-Candle Bottom Reversal Signal
The Hammer is a simple single horizontal candlestick reversal pattern and is only a potential bottom if it occurs in the right context.
A Hammer has:
-
A small body located near the top of the trading range
-
A long lower wick (usually at least double the size of the body)
-
Little to no upper wick
The Hammer represents a simple scenario; sellers drove prices down, and as the prices reached the low of the day, buyers entered aggressively and were able to push prices back to where they had been before the drop. The result is the distinct 'hammer' shape of this price action.
You may visualise this action as a compressed spring that is pushed to its maximum force and then suddenly and violently rebounds. While the market did trade lower, there was sufficient buying support to prevent it from trading even further below the low.
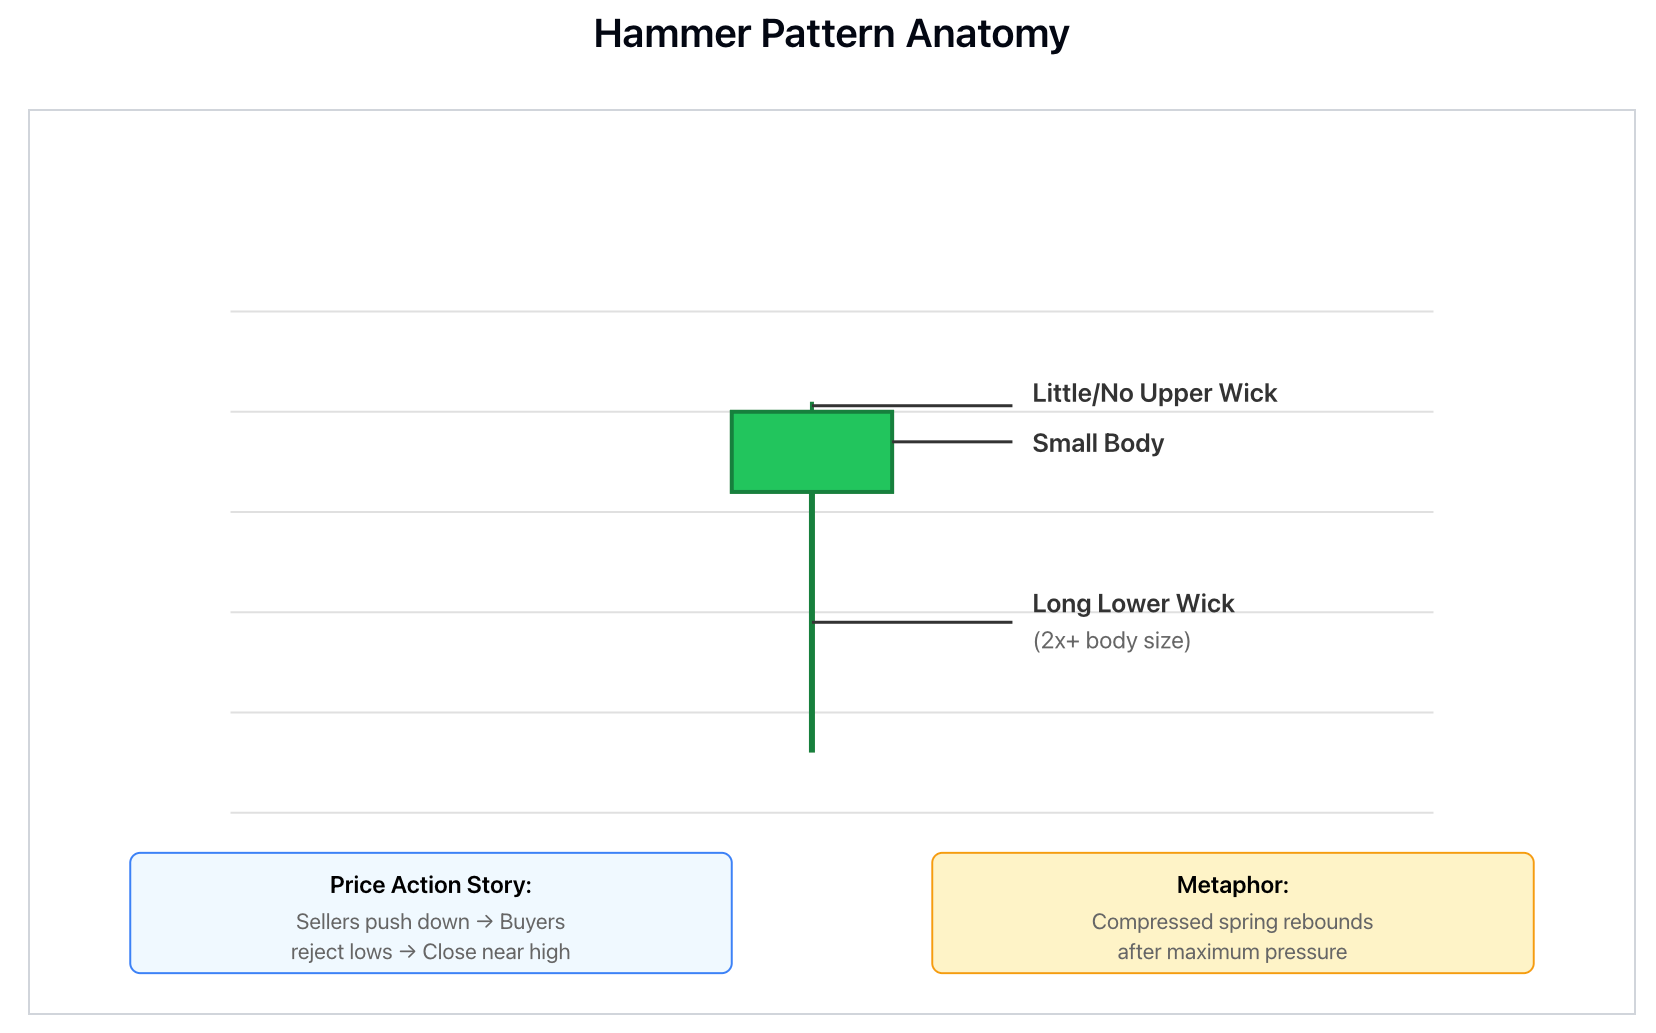
Recently, the NAS100 Index formed a Hammer pattern around the key support level and immediately bounced back approximately 1.5% in the following sessions. The timing of the pattern was excellent because it formed shortly after a large 'liquidity sweep' below the previous day's low to eliminate weak sellers before the reversal took place.
To achieve the best possible outcome from your Hammer trades:
-
Ideally, look for Hammers appearing at the end of a downward trend.
-
Look for Hammers forming at significant supporting areas.
-
Look for Hammers forming after liquidity sweeps.
-
Look for Hammers that confirm themselves by having a valid Breakout Candle.
Conditions that do not provide reliable signals for Hammers include the following:
-
Hammers with long upper shadows are considered to be Inverted Hammers.
-
Hammers forming in the middle of existing trends do not provide reliable signals.
-
Hammers formed during periods of low trading volume do not provide reliable signals.
-
Hammers that do not confirm through other candle formations following their formation do not confirm Hammers.
The Hammer is a less powerful signal than the Morning Star or Bullish Engulfing patterns. Although the Hammer will occur more regularly than these two patterns, it has a greater failure rate, and therefore, the trader should expect to see a confirmation candle after the formation of a Hammer.
Comparing the Three Reversal Patterns: Which is Most Reliable?
Traders typically assess which reversal candlestick enables them to find the best balance between reliability and frequency. The following table compares three reversal candlestick patterns across three significant dimensions (reliability, frequency, and signal strength) for reversal signals based on extensive technical analysis (TA) and market observation.
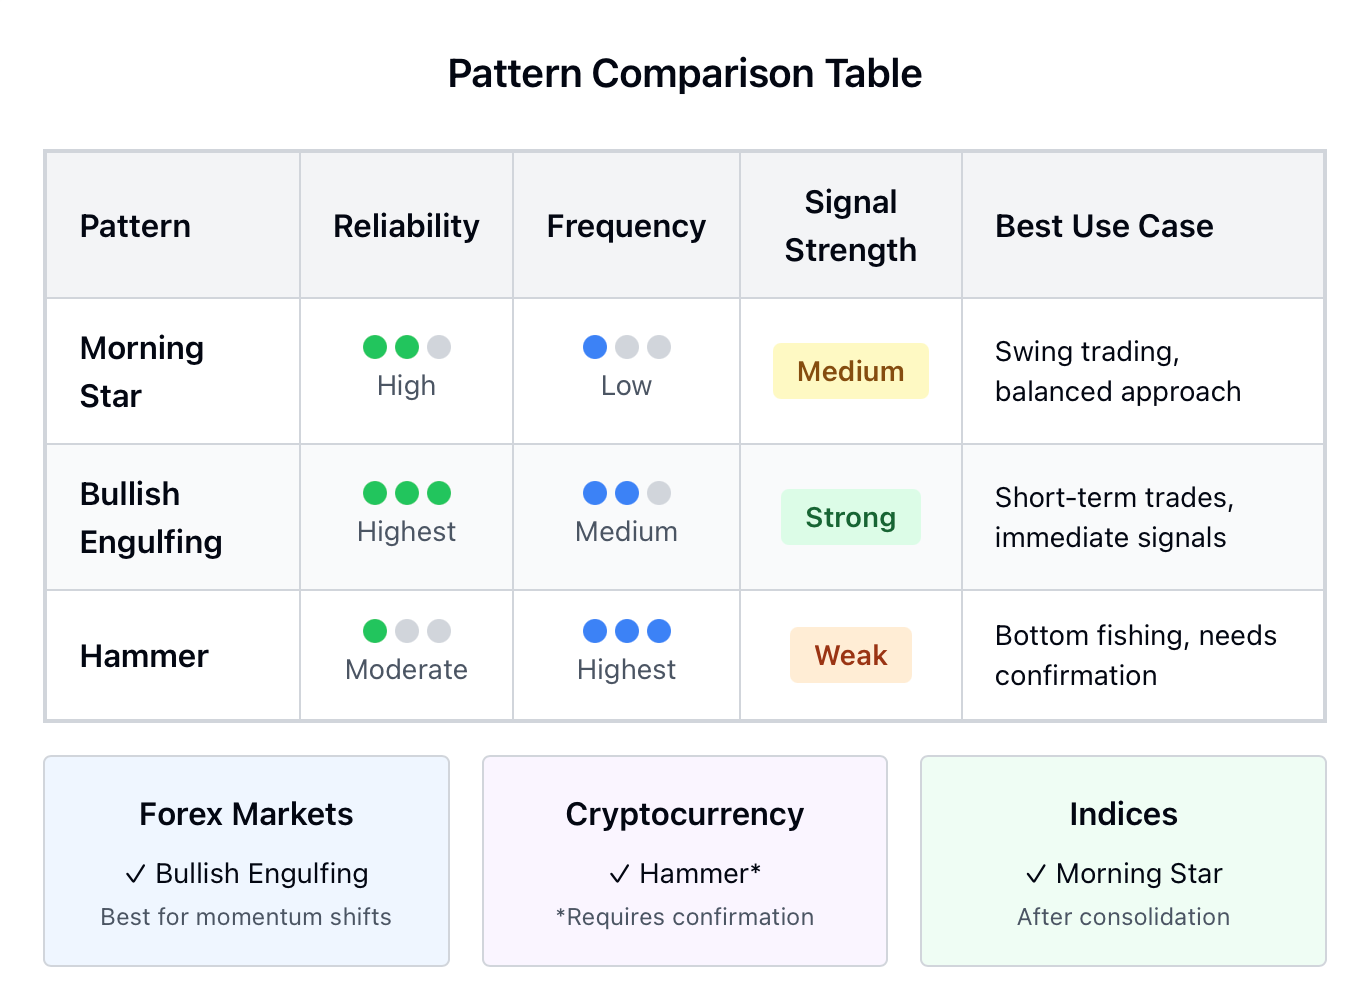
The ranking of these patterns is as follows:
Reliability from highest to lowest:
-
Bullish Engulfing Candlestick
-
Morning Star Candlestick
-
Hammer Candlestick
Frequency from highest to lowest:
-
Hammer Candlestick
-
Bullish Engulfing Candlestick
-
Morning Star Candlestick
Signal Strength from highest to lowest:
-
A Bullish Engulfing candlestick is the strongest signal immediately
-
The Morning Star candlestick is a medium-strength reversal signal
-
Hammer is the weakest immediate reversal signal.
All three patterns have a high false signal rate in a non-trending market due to low liquidity. In trending markets, Bullish Engulfing candlesticks represent the best chance of success, while the Hammer candlestick requires the most confirmation for reliability.
Depending on the type of market being traded, the types of markets where these patterns work best vary significantly:
-
Forex markets: the Bullish Engulfing candlestick performs best in the presence of strong momentum shifts.
-
Cryptocurrency markets: the Hammer candlestick pattern appears frequently, but must be confirmed before relying on it because of increased volatility in these markets.
Indices markets: The Morning Star candlestick holds steady after consolidation.
Think of these patterns as three different warning signals; each one has its own relative strength or weakness: weak (Hammer), moderate (Morning Star), and strong (Bullish Engulfing). The best choice of which to use is based on how you trade and your time frame.
For the practical application of these candlestick patterns in the market, use the following strategies:
-
For short-term trades: use the Bullish Engulfing candlestick, as it is the strongest immediate reversal signal.
-
For swing trades: use the Morning Star candlestick pattern, as it is a balanced or good intermediate-level reversal signal.
-
For bottom fishing (early market entry): use the Hammer candlestick pattern, as it is the earliest indication of a reversal, but it requires confirmation before acting on it.
A combination of pattern (reversal), locational elements, trend ability, and volume is necessary to develop an optimal signal. It is not possible to isolate any one of these components; therefore, traders rely on other confirmation techniques (e.g., multiple confirmations) before placing a trade.
This article provides practical tips and risk management for using reversal candlestick patterns in your trading:
-
Identify the general trend by using the High/Low structure.
-
Look for a reversal pattern at a point where a reversal is likely to occur.
-
Confirm critical supports and resistances, Fair Value Gaps (FVGs), and moving averages.
-
Look for volume confirmation.
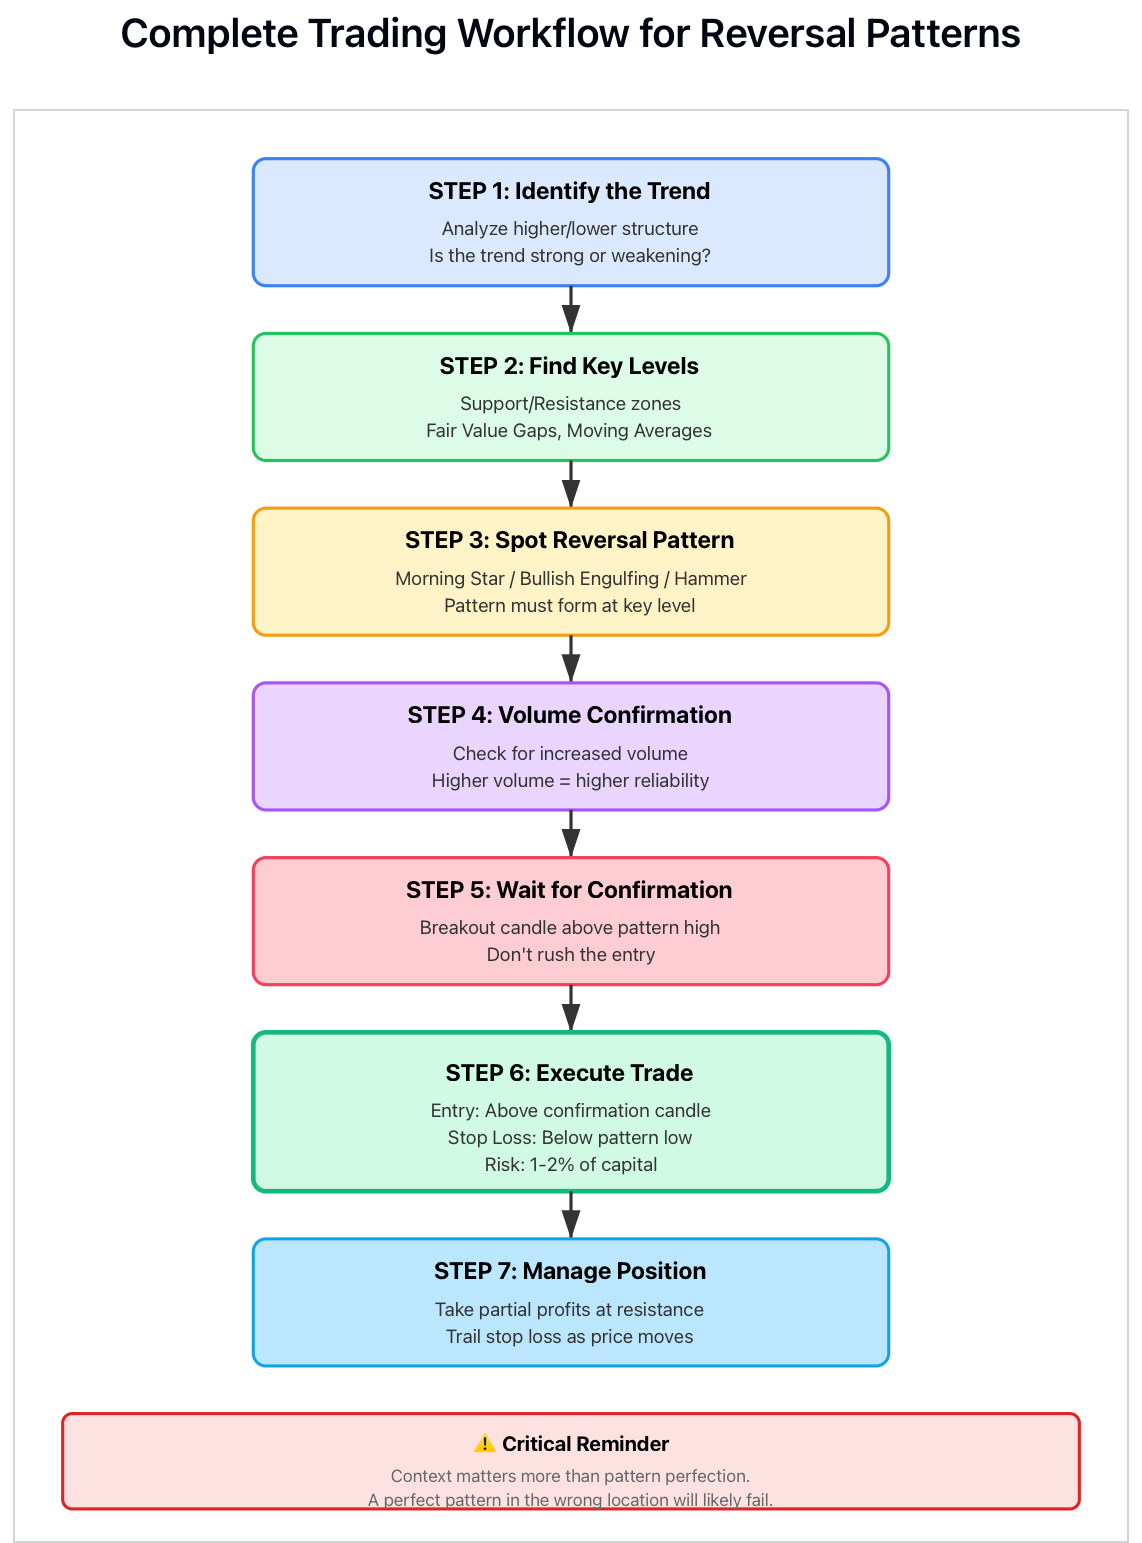
Once confirmed, enter the trade based on the price action of the breakout from the confirmation level of the pattern.
As an illustration, if you see a Hammer pattern, you will enter when the price breaks above the Hammer’s highest price with a stop placed below the Hammer’s lowest price.
A solid risk management plan is paramount. Place stop-losses below the invalidation points of the patterns. Limit your risk to 1-2% of your total trading capital on a single trade. When determining the number of contracts to trade, consider the amount of room below your stop. Take partial profits off the table at logical resistance areas.
How do multiple timeframes on a Trading System work?
-
Determine the higher time frame trend.
-
Look for reversals in lower-time-frame patterns, which confirm the likelihood of reversal at that moment.
-
Wait until both time frames match before making an entry.
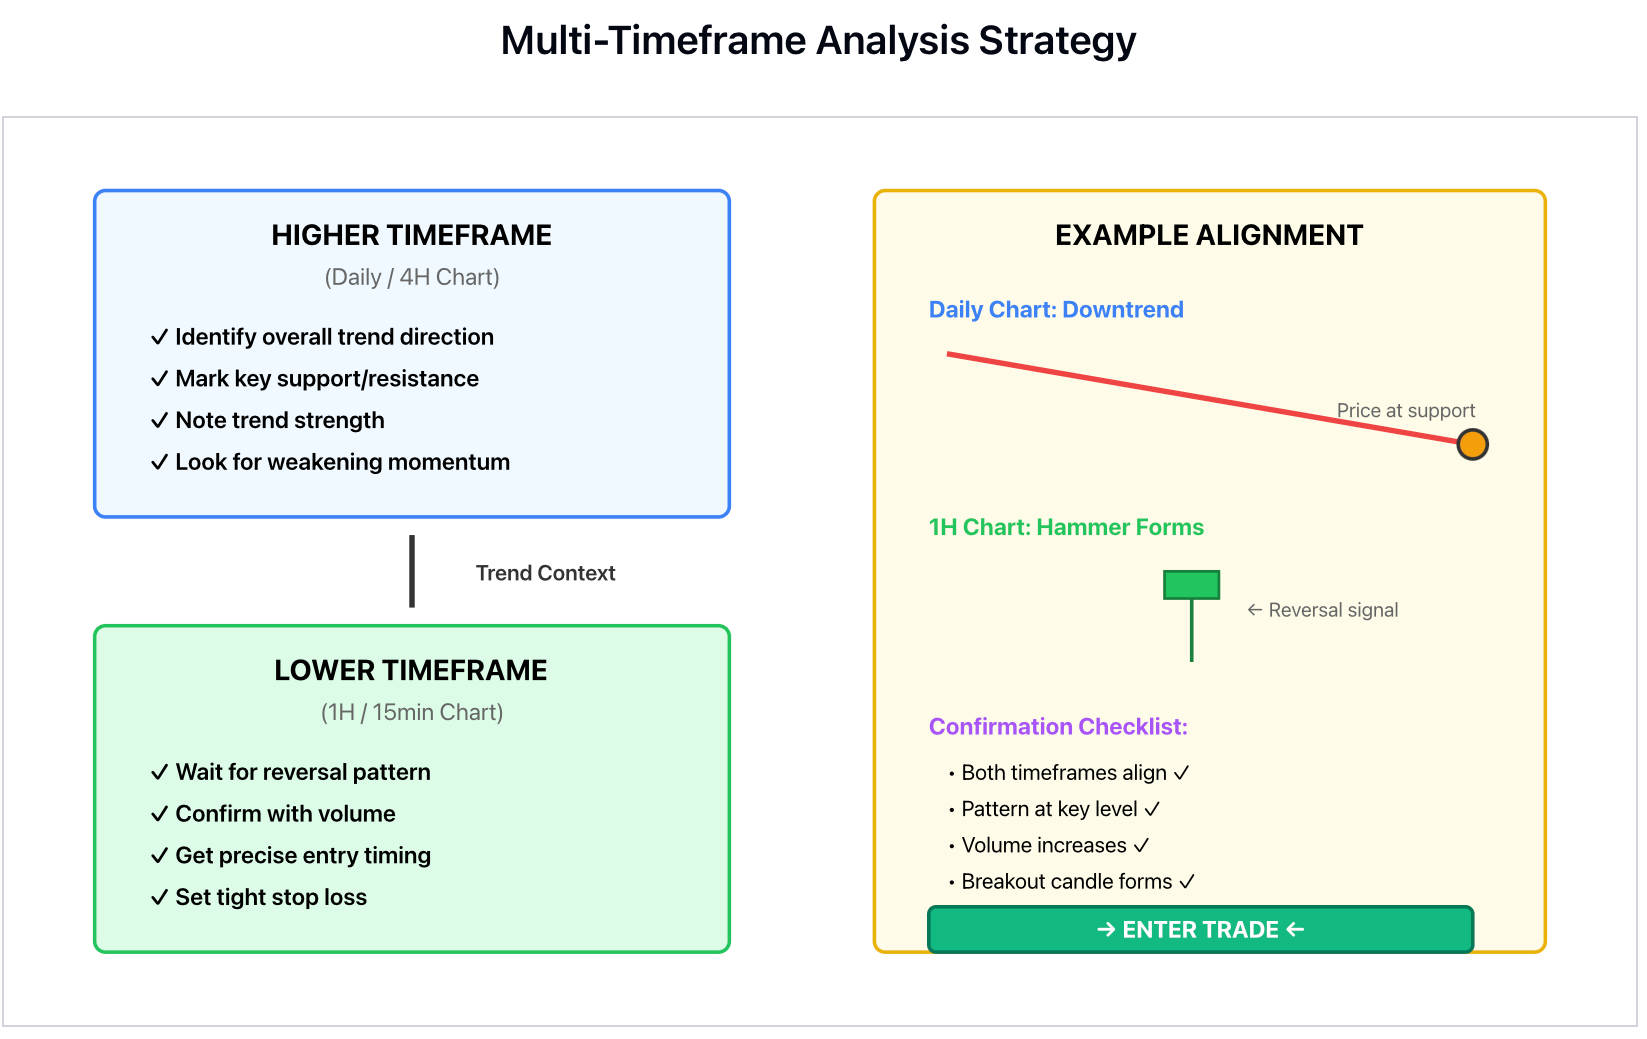
As for beginners, using the "colour change + liquidity sweep" strategy will be effective.
1. Identify a continued downtrend, i.e., using red candles.
2. Wait for the price below the most recent low to have a liquidity sweep.
3. Wait for a reversal candle to form, either a Hammer or Bullish Engulfing.
4. Once the price breaks above the reversal pattern, you can enter.
Finally, it’s important to note that while the pattern forms the basis of the trade, the actual trade location is just as important. A perfect pattern in the wrong location will most likely not be successful. Therefore, always consider the market activity prior to executing a trade based on any reversal candle signals.
How to Analyse and Backtest Reversal Candle Patterns In Your Trading Business
Cluster Analysis Only Becomes Useful If You Can Apply Theory To Trading In The Real World Using The Right Tools To Analyse, Test, And Optimise Your Strategy.
BTCdana Provides Tools That Enable You To Carry Out All Of These Analysis And Backtesting Tasks Easily:
Drawing Tools To Draw Reversal Candles Directly On The Chart.
-
Multi-Timeframe Charts To Enable You To Look At A Pattern From A Different Perspective
-
Using Indicators Already Included With BTCdana To Provide Confirmation That A Pattern Has Been Formed.
-
Place Alerts When The Patterns Are Formed On The Instruments That You Have A Watch List For.
To Effectively Backtest Reversal Candle Patterns, Here Are Some Steps You Can Take:
-
Choose An Asset You Want To Backtest (Example: The Gold Daily Chart).
-
Scroll Back In Time To The Points In Time You Want To Mark Your Historical Patterns.
-
Mark, What Occurred In Subsequent Price Action Based On These Historical Patterns?
-
Document The Success Rates Of The Historical Patterns Based On Different Market Conditions.
-
Determine What Patterns Are Best Suited For Specific Assets.
Ready to put these technical analysis concepts into practice? Open a demo or live account with BTCdana to start applying your knowledge of reversal candlestick patterns in live market conditions.
Summary of Best Practices for Using Candlestick Reversal Patterns
This guide has discussed three major reversal candlestick patterns: The Morning Star pattern, Bullish Engulfing, and Hammer candlesticks. They all have their strengths, so choose a reversal pattern based on your market condition and trading style.
The Morning Star is a more moderate pattern, meaning that it has a nice balance of reliability and frequency as a swing trader's tool. The Bullish Engulfing is the strongest in terms of an immediate signal, but requires careful placement. The Hammer is also one of the most commonly seen patterns, but it requires more confirmation.
Key Guidelines:
-
Candlestick patterns are signals, not guarantees.
-
Candlestick location regarding charts is more important than perfection in the candlestick patterns.
-
Market trends determine how reliable candlestick patterns are.
-
Candlestick patterns are more successful with volume confirmation.
If you are new to trading, spend 10 minutes a day simply observing the market structure and candlestick patterns without any expectations of trading. Over a period of time, you will develop your ability to recognise candlestick patterns.
As you gain your experience with Technical Analysis, keep in mind that professional traders do not chase every candlestick pattern. Professionals look for the best probability set-ups where several variables align together.
Are you prepared to start validating these patterns in the actual market? Before investing your actual money, you can use BTCdana.com to learn to identify and trade these candlestick patterns in a demo account. Reversal candlestick patterns have become a crucial part of your trading strategy through relentlessly practising them and developing sound risk management skills.