


1. Introduction: What Are Support and Resistance Levels?
Support and resistance are super important concepts in forex trading that every trader needs to get. Support is like a price floor where demand is strong enough to stop prices from falling any further. On the flip side, resistance is a price ceiling where there's enough selling pressure to keep prices from going up. In forex and CFD trading, knowing these support and resistance levels helps you figure out when to buy and sell since they show where prices usually pause or turn around.
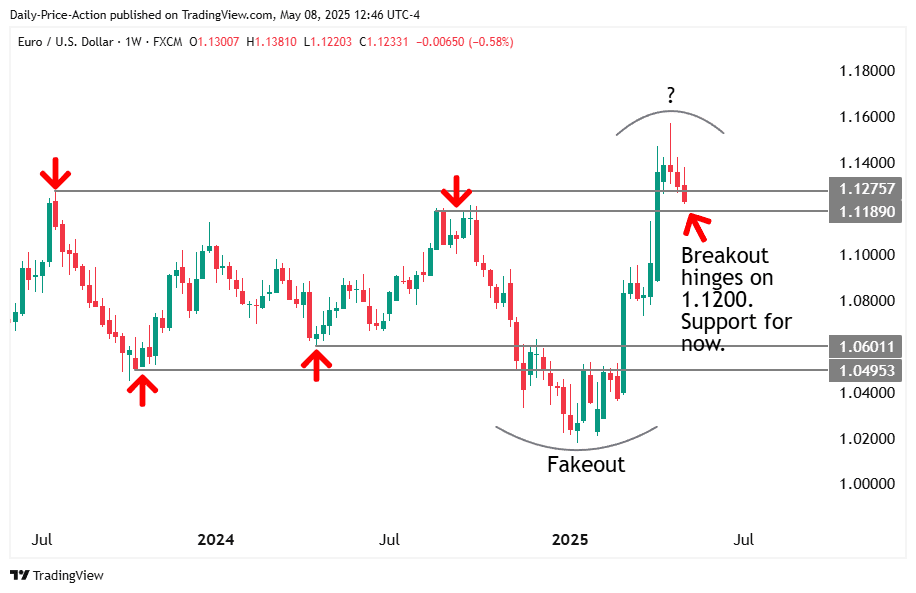
These levels are not merely technical; they are deeply intertwined with market psychology. For instance, when EUR/USD consistently bounces off the 1.0500 level, traders recognize this as a support area, while the 1.0500 level routinely limits upward movement, marking it as a resistance area. Traders—whether they're just starting out or from big institutions—keep an eye on these key price points because they show where a lot of orders are placed.
In this article, we’ll break down what support and resistance mean in forex trading, how to spot them, and how you can use them to time your market entries and exits better.
2. The Psychology Behind Support and Resistance
Basically, support and resistance levels work because traders believe they matter. This belief is part of forex psychology and how people think. Traders remember when prices bounce back at certain levels, and those points stick in their minds, influencing their future trades. This psychological element makes these levels feel significant, so traders start to expect them.
A common example of this is anchoring bias, which often happens around round numbers like 1.2000 or 1.1000 in EUR/USD. These levels attract a lot of stop-loss orders, pending orders, and profit targets. Retail traders often set orders at these memorable numbers, and big institutions also place large orders there, which creates a cycle that reinforces these levels.
Fear and greed are also crucial factors. At support, the fear of missing out (FOMO) may drive traders to buy as they expect price rebounds. At resistance, greed can motivate traders to sell as they predict a price reversal. A classic illustration of this behavior can be observed in GBP/USD, which repeatedly struggled at the 1.3000 level in 2024. Traders continually expected resistance at this price, leading to recurring bounce and rejection patterns.
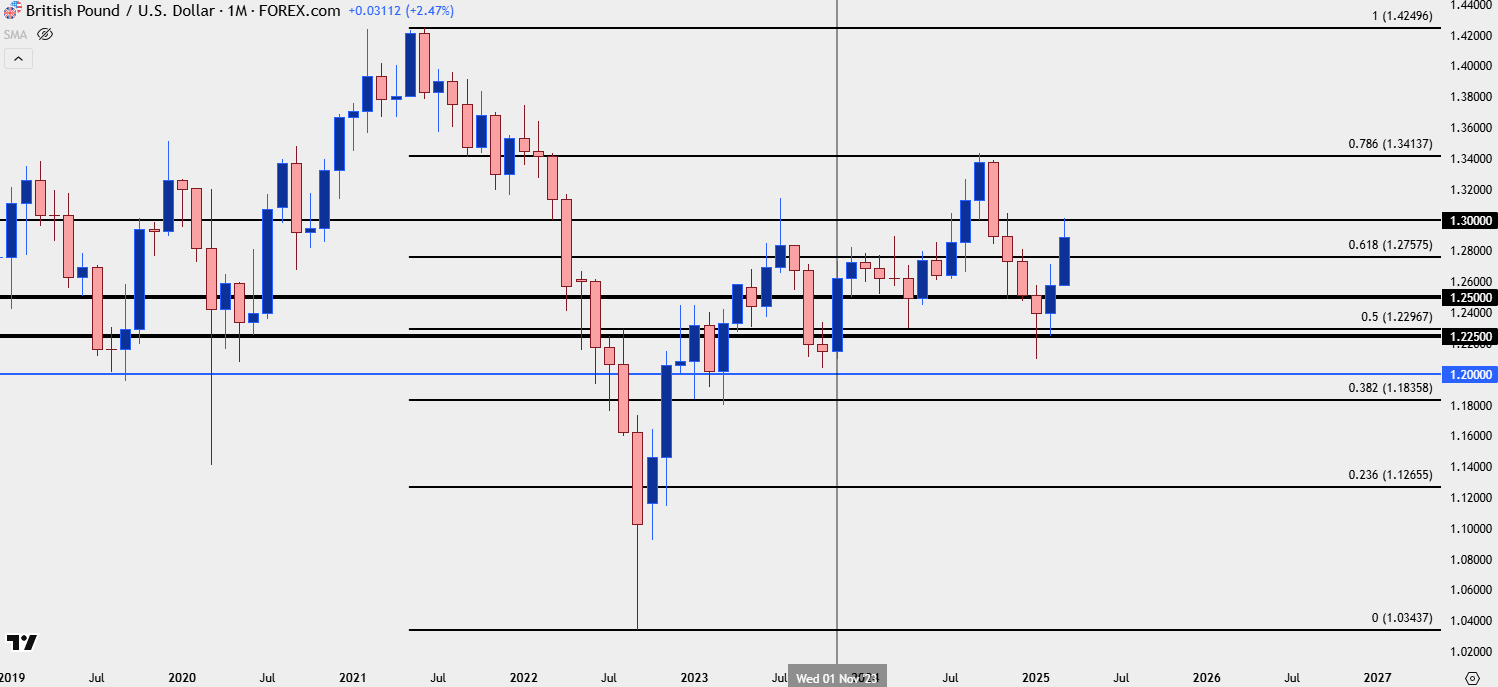
Understanding this behavioral framework enables you to trade more logically around these zones, aligning yourself with the broader market dynamics.
3. Common Methods to Identify Support and Resistance
Traders employ various techniques to delineate support and resistance levels, each offering valuable insights into price points where the market may reverse or consolidate. Mastering how to draw support and resistance can greatly enhance your decision-making in forex trading and cryptocurrency.
In practice, merging techniques boosts dependability. For instance, EUR/USD frequently finds support at its 200-day moving average, whereas AUD/USD might adhere to a 38.2% Fibonacci retracement. Identifying where methods intersect can greatly enhance forecasting accuracy.
These strategies are not exclusive; when various methods converge at a similar price point, the area becomes particularly trustworthy. For instance, when the 200-MA coincides with a historical swing low and a Fibonacci level, that area can serve as significant support or resistance.
4. Validating Support and Resistance Zones
Determining a zone is merely one aspect—assessing its strength is crucial.
-
Number of touches: A zone experiencing 3-4 rebounds is considerably more dependable than one with only a single touch. This confirming of support and resistance is vital for identifying valid zones for trading.
-
Reaction intensity: Distinct, sharp reversal candles indicate genuine interest. Weaker rejections often lead to breaks on subsequent attempts.
-
Volume response: Elevated trading volume at the support/resistance enhances credibility. Tools like tick volume indicators or on-chart volume bars validate these areas.
-
Timeframe: Zones defined on higher timeframes (Daily, Weekly) typically outperform those on intraday charts—they reflect broader market sentiment and larger order flows.
-
Price confirmation: A confirmed bounce or unsuccessful breakout (e.g., wick reversal) reinforces a zone more than a simple price crossing.
For example, AUD/USD once briefly dipped below support at 0.6700 but reversed sharply, closing above with a long lower wick. This unsuccessful breakout indicated a stronger rebound potential from that support, bolstered by volume spikes observed on the 4-hour chart.
Integrating touch count, volume, candle shape, and timeframe provides you with high-probability zones that are worthwhile for trading.
5. How to Trade Using Support and Resistance
Once you've figured out and confirmed your support and resistance areas, you can set up some smart trading strategies:
Bounce Trading
You can go long near support after seeing a confirmed bullish reversal. Put a stop-loss just below the support line and aim for the next resistance level to make a profit. This strategy works well when there's clear price confirmation, like a bullish engulfing candlestick pattern.
Breakout Trading
Start a trade only after a clear candle closes beyond a zone. Use volume or indicators like RSI or MACD to back it up. Place stops just inside the breakout zone and set realistic targets using Fibonacci extension levels.
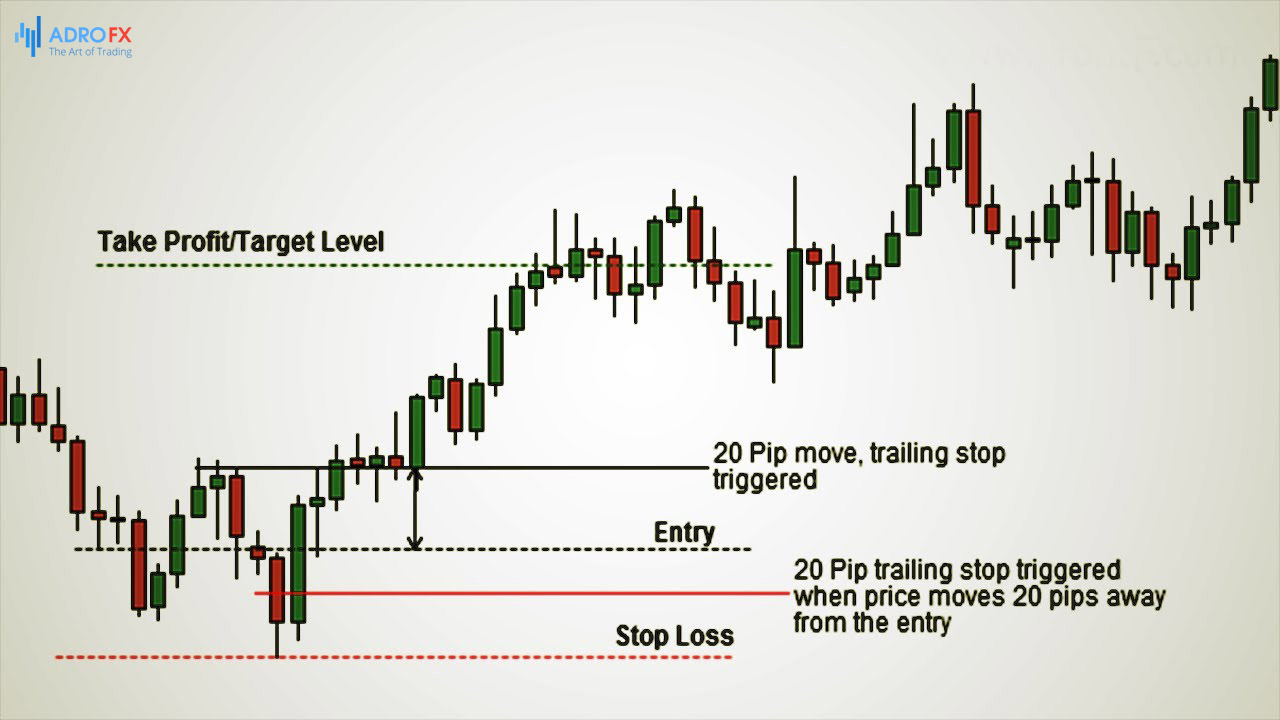
Risk Management
-
Risk only 1-2% of your capital on each trade.
-
Maintain a minimum reward-to-risk ratio of 2:1.
-
Avoid emotional scaling or averaging down.
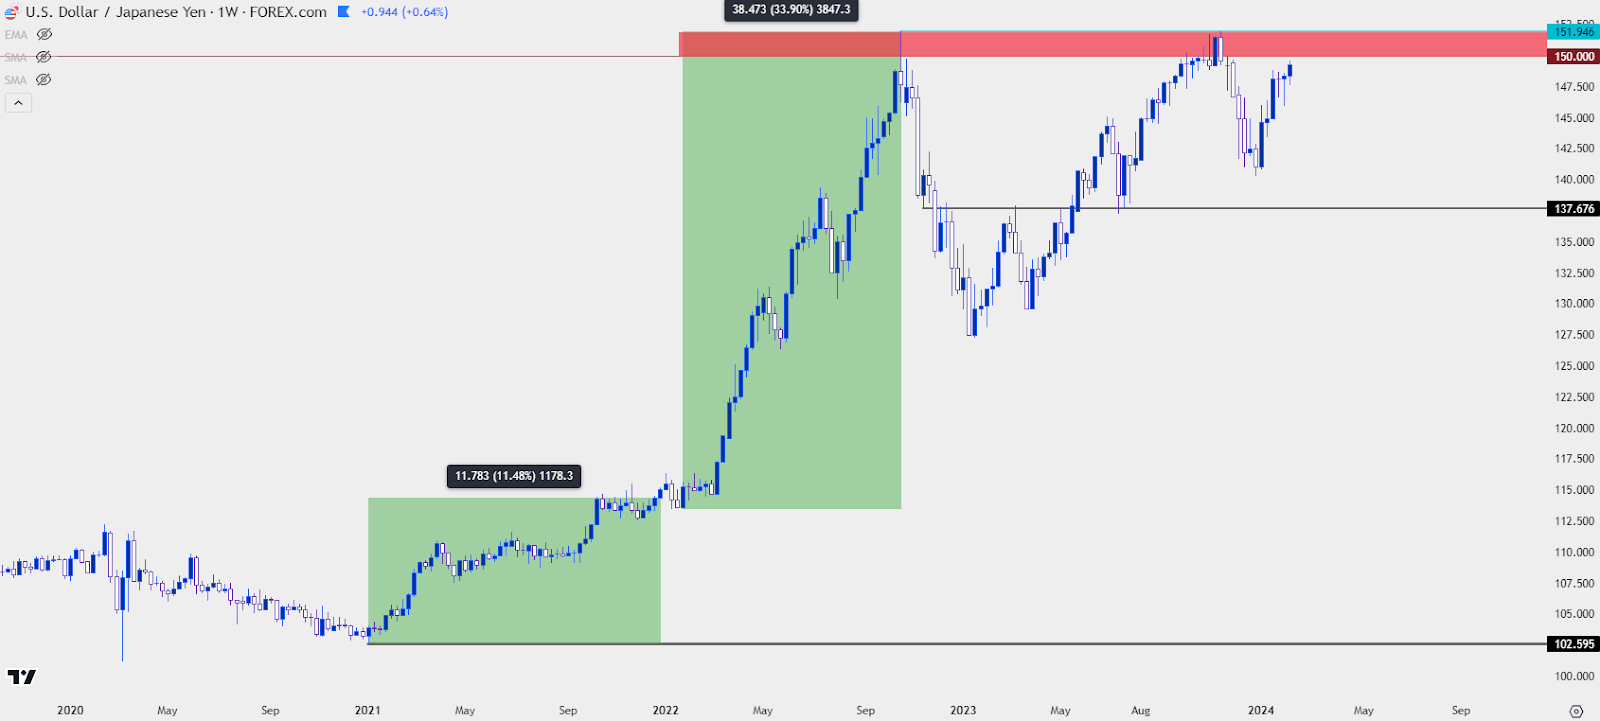
For instance, on a USD/JPY chart, a bullish engulfing candle formed at 111.00. A trader entered long with a stop at 110.80 and took profit near the next resistance area at 112.00.
These strategies enable traders to systematize their method, utilize objective entry points, and manage losses effectively.
6. Common Mistakes to Avoid
Even seasoned traders can fall into these forex trading traps:
-
Overloading charts with excessive lines on minor price fluctuations
-
Disregarding the importance of the timeframe (e.g., applying 5-minute support/resistance for swing trades)
-
Entering breakouts too early without the confirmation of a closing candle
-
Neglecting to consider news events that can skew technical patterns
-
Depending exclusively on support/resistance without validation from volume, candlestick patterns, or indicators
For instance, the EUR/USD pair frequently misleads traders during FOMC announcements—prices may briefly exceed resistance only to sharply reverse due to the news.
Steering clear of these pitfalls safeguards your capital and enhances your trading choices.
7. Advanced Tips: Dynamic vs. Static Levels
Support and resistance can be categorized as either static or dynamic.
-
Static levels consist of horizontal lines derived from historical price movements and remain unchanged.
-
Dynamic levels adapt in response to indicators like EMAs or Bollinger Bands.
Rather than anticipating price reversals at exact points, consider them in terms of zones. When dynamic levels (like a 20-EMA) coincide with a static zone, it creates a high-probability confluence area.
For example, in gold (XAU/USD), price increases often plateau at the 20-EMA if it corresponds with a previous high. This combination improves the likelihood of a reversal.
By integrating both dynamic support resistance and static levels, you enhance flexibility in your analysis, providing multiple confirmation layers before executing a trade.
8. Conclusion and Call to Action
Support and resistance are essential components of technical analysis. They aid in identifying where price may shift direction and offer crucial levels for making trading decisions. With the proper blend of validation, charting resources, and discipline, these levels can contribute to the enhancement of your strategy over time.
Call to Action:
Practice leads to mastery. Head over to btcdana.com to try out support and resistance in real-time. Utilize BTCDana trading tools like pivot calculators, trendlines, and EMAs to perfect your trades without any risk.