


Introduction | Why the Asian-London Session Overlap is the Forex Market's "Golden Window."
The forex market operates around the clock and throughout the week in a continuous manner. The trading activity flows from one major financial centre to another without interruption; however, not all times within the forex market are equally active.
For example, within the Asian trading session, the forex market tends to have very little volatility (at this time, liquidity is usually very thin), and the price movement will appear to be almost always predictable. When London opens for trading, everything changes. Suddenly, there is an influx of Institutional money as well as more volatile price movements (such as price movements may move up or down in 30 to 50 pip increments within a matter of minutes).
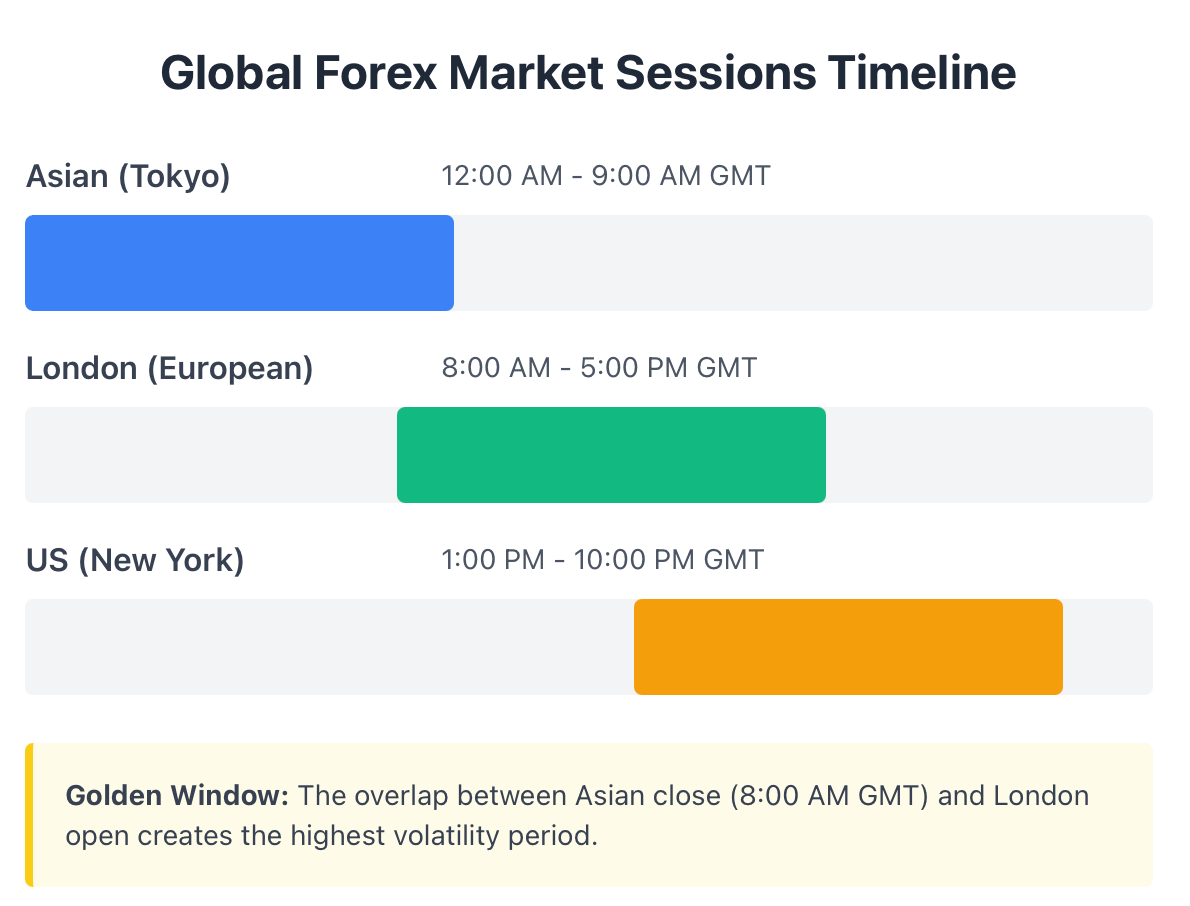
The period between the end of the Asian trading session and the initial London opening is termed by experienced Traders as "The Golden Window" in the forex market. It is within this timeframe, the Energy produced from the developing trends during the Asian trading sessions will suddenly be released into a trending move that can result in a tremendous amount of price movement.
As described above, the Energy Momentum Transition, or EMT, is key to identifying, within this timeframe, when the Calm Market will "explode" into Trending Moves. By understanding what such an EMT window is, you will know when to buy or sell and will be able to take advantage of any significant breakout that creates major financial opportunities, while at the same time, it will help you avoid getting stopped out due to Whipsaw Price Action.
All traders can benefit from this guide. New traders will understand what the overlap period is and how to navigate it safely. Intermediate traders will find valuable strategies based on data, along with templates ready for immediate use. Advanced traders will receive insight into order books, liquidity pockets, and EMT signals: all at an institutional level.
Why should all traders consider using the overlap as their trading strategy?
Global Forex Market Structure & The Three Major Sessions: Understanding Volatility Sources
To understand the significance of overlap, we must first examine how the Forex market operates in its three main market segments:
Asian Session (Tokyo) - 12:00 AM to 9:00 AM GMT (the Japanese Session)
The Asian Session is primarily made up of institutional settlement flows, central bank operations (CB), and minimal retail activity. This time frame is referred to as the market's "administrative period" because banks are busy balancing their books, corporations are settling cross-border payments, and speculative trading is infrequent. This is evidenced by the low volatility, thin order book, and frequent false breakouts associated with this session. While the majority of the trading activity during this session occurs with the AUDJPY, NZDUSD, and USDJPY currency pairs, their movements tend to be slow and cautious.
London Session (European) 8:00 AM to 5:00 PM GMT (European Session)
As soon as the London market opens for business (London being the largest financial centre in the world), it immediately generates a significant amount of new institutional order flow into the Forex market. European banks, hedge funds, and multinational corporations engage in very active trading and therefore generate large amounts of trading volume. The Forex market volume increases significantly at this time, and orders on the order book become very deep, leading to much greater price movement in one direction than is typically seen in the Asian session. Some of the primary currency pairs being traded during this session are the EURUSD, GBPUSD, EURGBP, and USDCHF currency pairs.
U.S. Session (New York): 1 PM - 10 PM GMT
Opening in New York at 1 pm through to 10 pm GMT creates an overlap with the very end of the London trading session, therefore providing a large spike of liquidity as well. Combining both session totals creates the highest global volume due to both sessions. Typically, the trading volume for all currency pairs based on the US Dollar will be the majority of the volume in the market, and quick, volatile, and unpredictable price movements are usually caused by significant economic data releases from the United States being released at this time.
The key takeaway is that there will be different types of participants within each trading session and, accordingly, the participants in these trading sessions will alter the way the prices move. Participants who trade during the Asian session are primarily covering, either through hedging or settlement. Participants who trade in London, however, are primarily speculators who are positioning themselves; therefore, these different types of trades will be one of the reasons for the higher volatility during the overlapping periods of time between these two trading sessions.
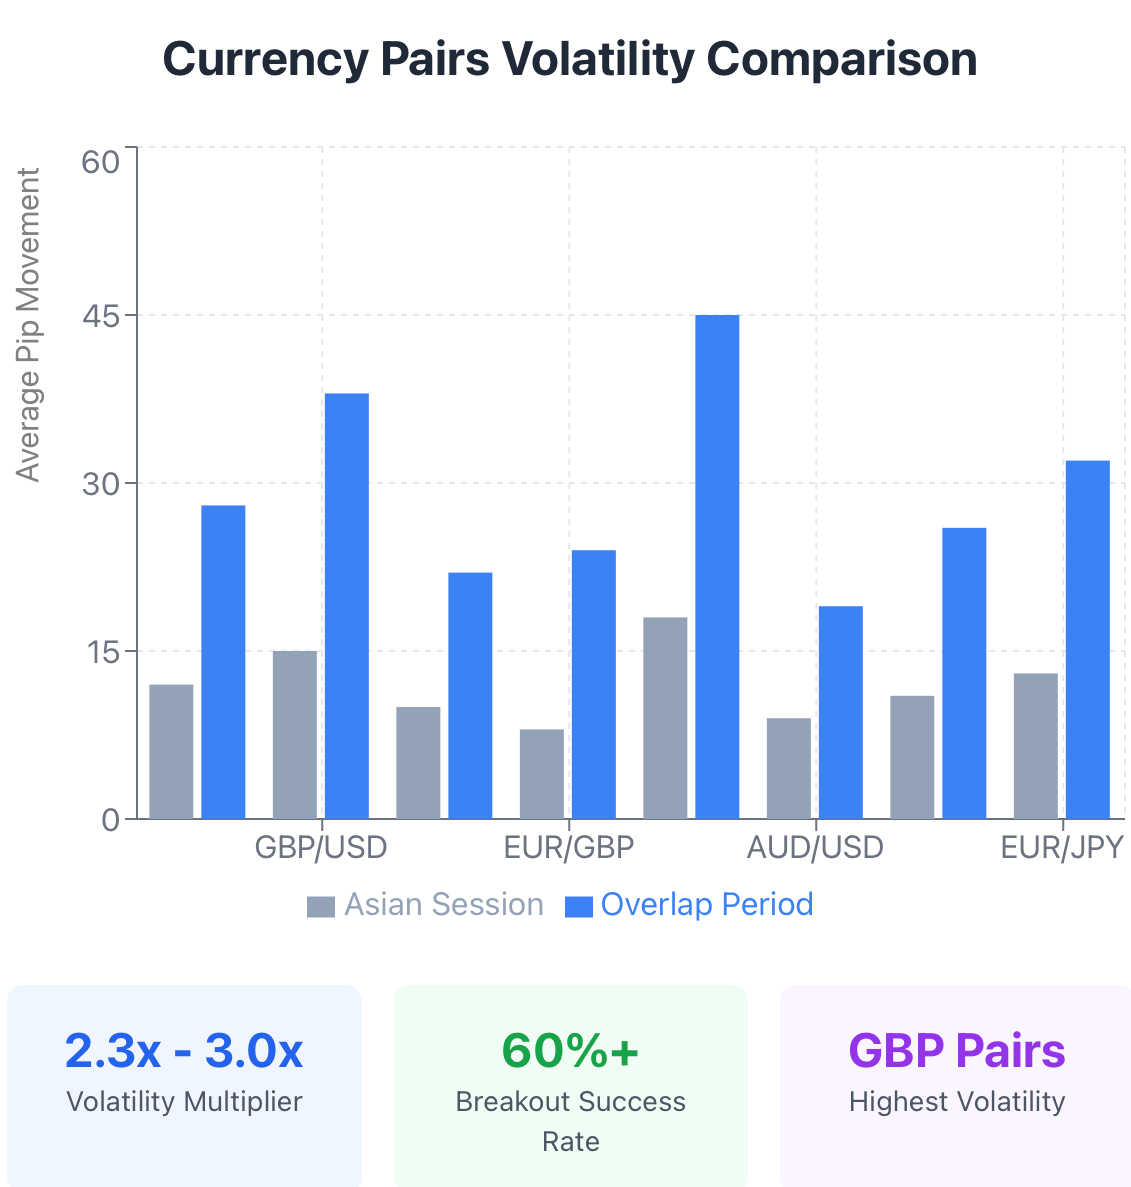
According to the 2024 data on GBP/USD, this currency pair had an average of 8 pips per hour in the Asian Trading Session compared to 22 pips per hour in the London Trading Session, or approximately three times as much volatility during the same currency pair from the type of trader who is trading the GBP/USD.
Why the Asian-London Session Overlap is Critical
We are going to discuss the underlying mechanisms that allow this overlap to cause such violent moves in price. The Asian session is the build-up of potential energy for the market. Price action is being consolidated in tight ranges, and stop-losses are being created on both sides of key price levels.
Traders are waiting for the price direction. At this point, the order book is very shallow, meaning that there is not much liquidity (the number of buyers/sellers) at the various price levels, and therefore large orders can push the price around very easily, although this does not happen frequently due to lower Trading Volume.
When the London market opens, and banks update their algorithms for pricing their instruments, the European banks begin executing client orders, market makers are adjusting their quotes based upon information that they received whilst the Asian market was closed. All of the built-up potential energy available during the Asian session is now triggered, similar to an archer releasing an arrow from a pre-drawn bowstring.
To visualise how this process works, think of the Asian session as a room filling with gas, and the trigger point for the violent move of the price is someone flicking a lighter. The explosion that occurs is not a random occurrence; it is a culmination of built-up pressure being met with a catalyst.
Professional traders should understand these mechanics on a deeper level: ADRs of HK stocks create sentiment over the elevation of risk on/risk off flows. For example, when Asian trading desks submit their order books in the overnight session, the Eurozone trading desks of several European banks are usually required to rebalance positions held in Euros, pounds, and Swiss Francs. After receiving large volumes from their Asian customers during London morning trading hours creates a directional bias is created that does not exist during the Asian trading hours.
At times during these two hours the spread between the bid and ask prices for a currency pair will become momentarily wider as liquidity providers adjust their positions; after many traders move in the same direction as they are transitioning into the London market; the spread will usually return to normal when it becomes compressed due to increased volume of participants entering into an already existing price level. This movement is indicative of the start of energy transfer from stored to kinetic energy transition occurring between the Asian session and the London session in Europe.
Between January 1st through June 30th, 2024, 68% of the major EUR/USD daily price movements occurred occurring the first 90 minutes of the London open price movement. This is not a coincidence; it's an established structure that continues to develop.
Top 10 Currency Pairs' Volatility During Overlap
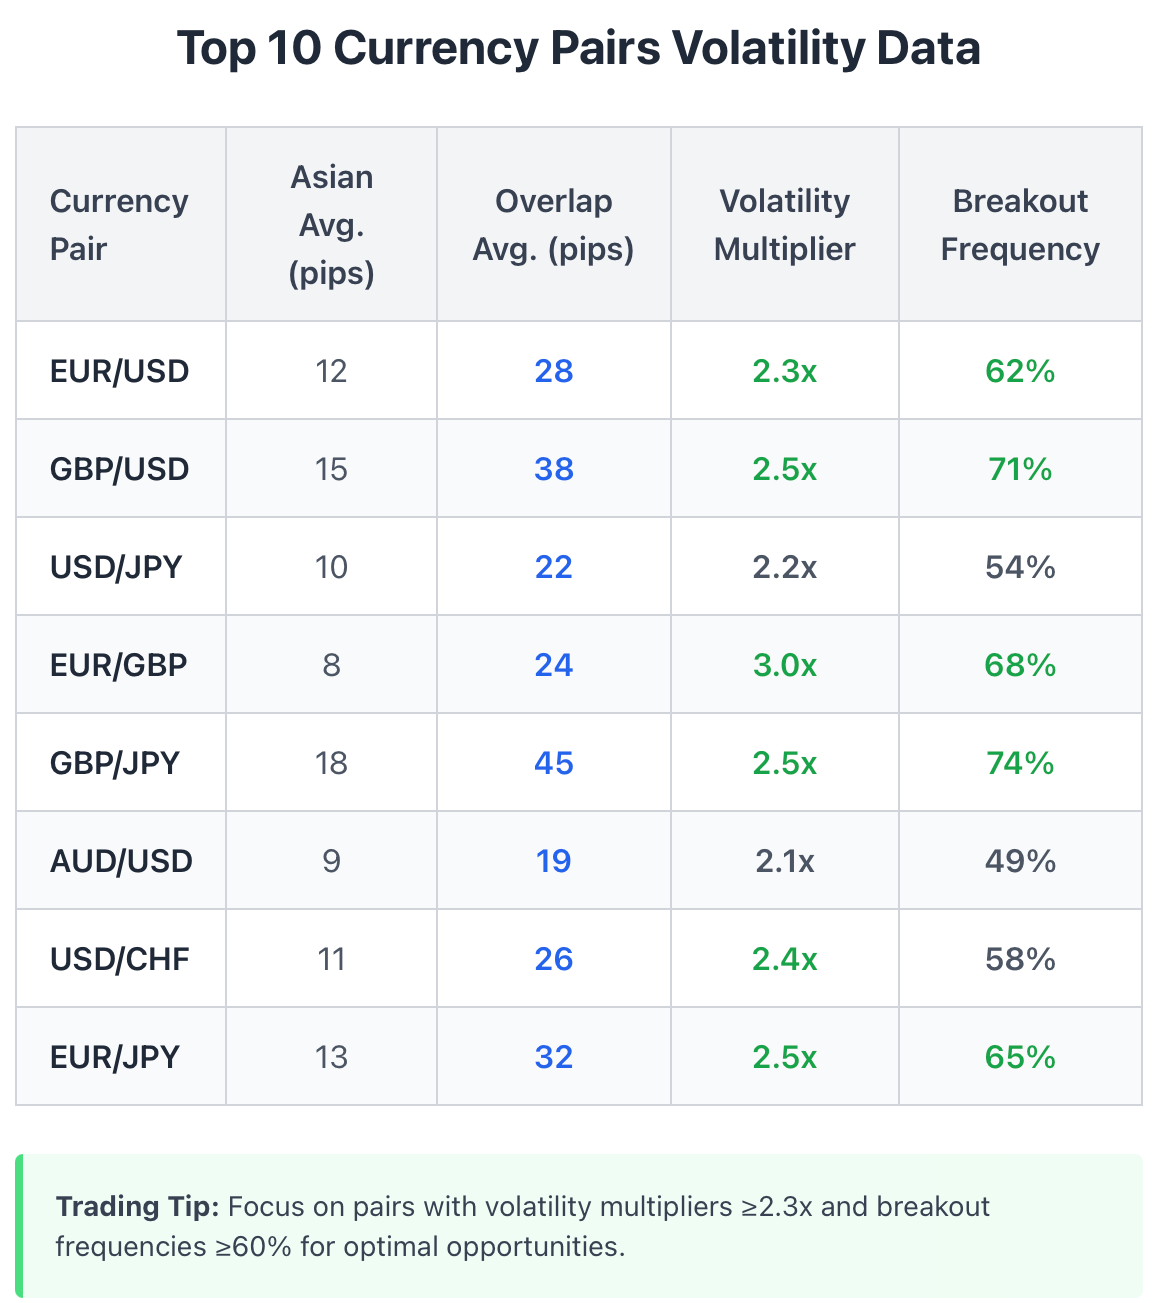
Let's put numbers to this phenomenon. Below is historical data from January to June 2024, showing average pip movement and ATR (Average True Range) during the Asian session versus the overlap period.
Summary of Key Findings:
-
GBP pairs have consistently displayed higher ratios of volatility multipliers and breakout frequencies than other currency pairs.
-
EUR/USD balances liquidity and price movement for most traders.
-
The AUD/USD and NZD/USD are significantly more active during their respective time zones than previously reported.
-
60% breakouts indicate that over 50% of Asian session range-bound consolidations produce price movement directionally when the London session opens.
-
The average ratio of false breakouts (not shown here) is approximately 30-35% across all currency pairs, suggesting that two out of every three breakouts produce true price direction versus being fakeouts.
-
To identify your maximum advantage, focus on currency pairs having volatility multipliers greater than 2.3x and breakout frequencies greater than 60% as this represents a statistically significant area.
Order Book Analysis: Why London Can Redirect Asia Session Price Paths
Understanding why volatility is amplified requires thinking from an institutional perspective.
During Asian trading hours, order flow is limited. Think of this concept using the analogy of a bucket that is only partially filled with water. When you pour a cup of water into the bucket, the overall water level rises significantly; therefore, large price movements can result from small orders. However, because no continuation of order flow exists in the Asian session, these prices usually retrace.
Once London opens and Bank interbank orders from major banks flood in, the liquidity in the bucket becomes established, and thus, the market-makers are now providing the market with a much deeper liquidity profile. The same size order that may have created a price movement of 10 pips in the Asian session, now only creates approximately a 2 pip movement, but this momentum is backed by legitimate volume.
Here is where the importance of understanding the stop clusters becomes critical: During the Asian session, many stop clusters are located just above resistance and thus below support levels. The locations where Retail Traders use stops to protect their positions are predictable, and Smart Money is aware of that. Once London opens, the first movement in price is often executed to exceed those Retail stop clusters, providing a source of liquidity for the Smart Money to take their position.
The use of EMTA Logic during the Asian session and London Session Alerts can become methodical through action. An example of this is the Asian session showing a tight range and multi-level Stops occurring, then the London session opening and creating a large increase in Price Action direction through the Stops. The increase we are often waiting for occurs once the Stops have been triggered and absorbed.
To understand it this way: Think of the price action from the Asia Session as a whisper in a fully empty Auditorium, where, when the London Session opens, it is like a large Crowd filling it, so it no longer hears the whisper, and the Crowd determines where they are from that point on.
For novices, this can be broken down: Do not fight the Flood; instead, watch to see where the Water is flowing, then position yourself for it.
For experienced traders, pay Attention to the Cumulative Volume Delta (CVD) and the Volume Weighted Average Price (VWAP) at the Opening of the London Session. If there is a Spike in Price but a Lack of CVD Confirmation, you are More than likely experiencing a False Breakout created to make traders enter the position prematurely.
Three Common Price Patterns During Overlap
Recognising patterns in the market will give you a significant advantage during this unpredictable time frame. This list contains the three most consistent patterns that recur during the Asian and London market overlaps.
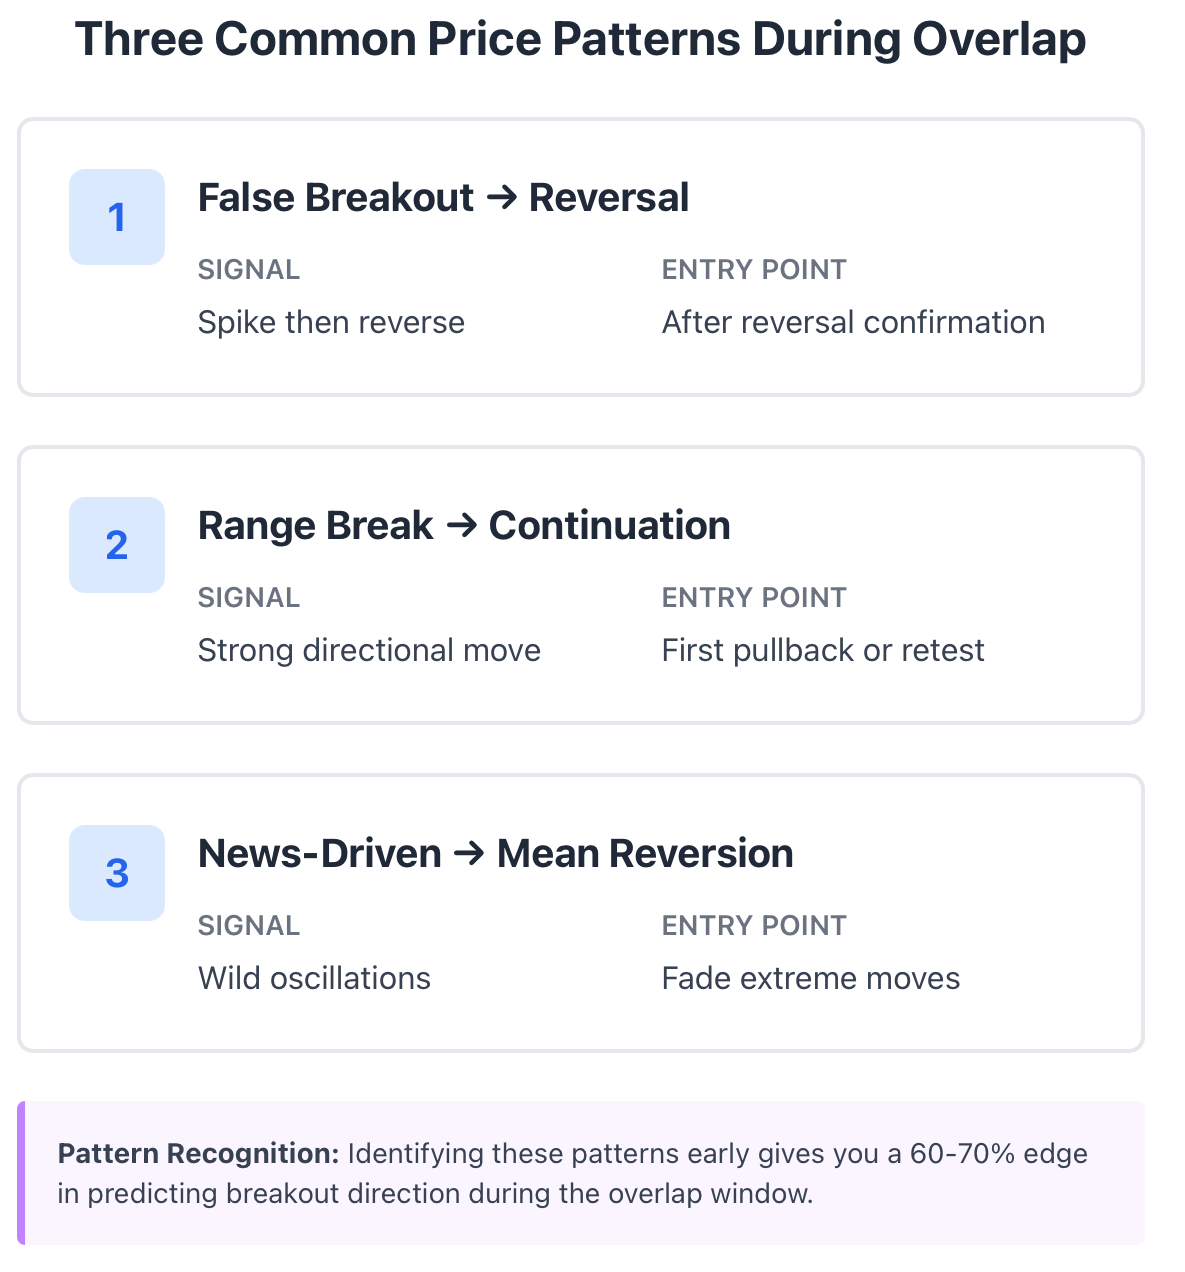
Pattern 1: False Breakout → Reversal Back Down
In the Asian sessions, prices will frequently test the upper or lower end of the trading range, but usually cannot hold that position due to low volumes of transactions taking place at that time. When the London session starts, traders will then test that same level but with significantly higher transaction volumes. Instead of breaking through, prices will often display a very sharp reversal to the opposite side.
For you to enter into this trade:
-
Ensure there is a clear trading range established at the Asian session.
-
Monitor the first candle of the London session, and confirm that it spikes through the established range before closing back into the range.
-
Confirm that there is notable volume associated with the candle that caused the price reversal.
Your entry point for this trade will be based on the reversal confirmed by the closing price action above the last broken price, and the next candle will create the opposite movement from the last candle that included the breakout/failed attempt.
For a stop/loss order on this trade, use the highest/lowest price that created the false breakout.
Simple explanation:
The market is trying to trick you into buying/selling with an impulse move and then trapping you by reversing on you before completing this formation.
Pattern 2: Rapid Asian Range Break → Trend Continuation
The typical pattern for an explosive breakout is shown here. Asian trading times feature price tightly consolidating, next the London opening begins to produce directional volume, pushing price through either support or resistance, and continuing on in that direction.
To confirm an explosive breakout, wait for the following conditions to occur: Price has created a narrow Asian price range (low ATR), then price breaks out of this range with strong momentum, and there is no immediate pullback after the breakout.
When you are ready to enter your trade, do so on the first pullback after the breakout, or when the broken level is retested.
Set your stop-loss below the low of the breakout candle (for buy trades) or above the high of the breakout candle (for sell trades).
For beginners: The London market has traders from different countries all trading together, and when they all agree on where prices should go, they put much more pressure on prices than when only part of the market is participating. You want to ride that pressure and momentum, not stand in front of it, blocking its way.
Pattern 3: News-Driven Oscillation → Mean Reversion
There are some situations when there is a ton of high-impact news released right at or around the time that London opens. Because of this, you will usually see wild swings (up/down) in price after the initial news release causes an extreme amount of volatility (or chaos) for approximately 10-15 minutes. In this type of scenario, price will usually "hover" around a central price point or mean value.
The main entry trigger here is to wait for the price to calm down and then "fade" the extreme price movement back toward the central value, thus capturing a profit.
A tight stop-loss is usually placed just beyond the last swing high and low.
A beginner can think about this as waiting until the dust settles after a bombshell news release and then betting that the price will revert to its previous normal level.
All four of these patterns belong in a trader's toolbox; the trick is figuring out which pattern is present by observing how London is opening and how volume confirms or denies the initial move after volume settles down.
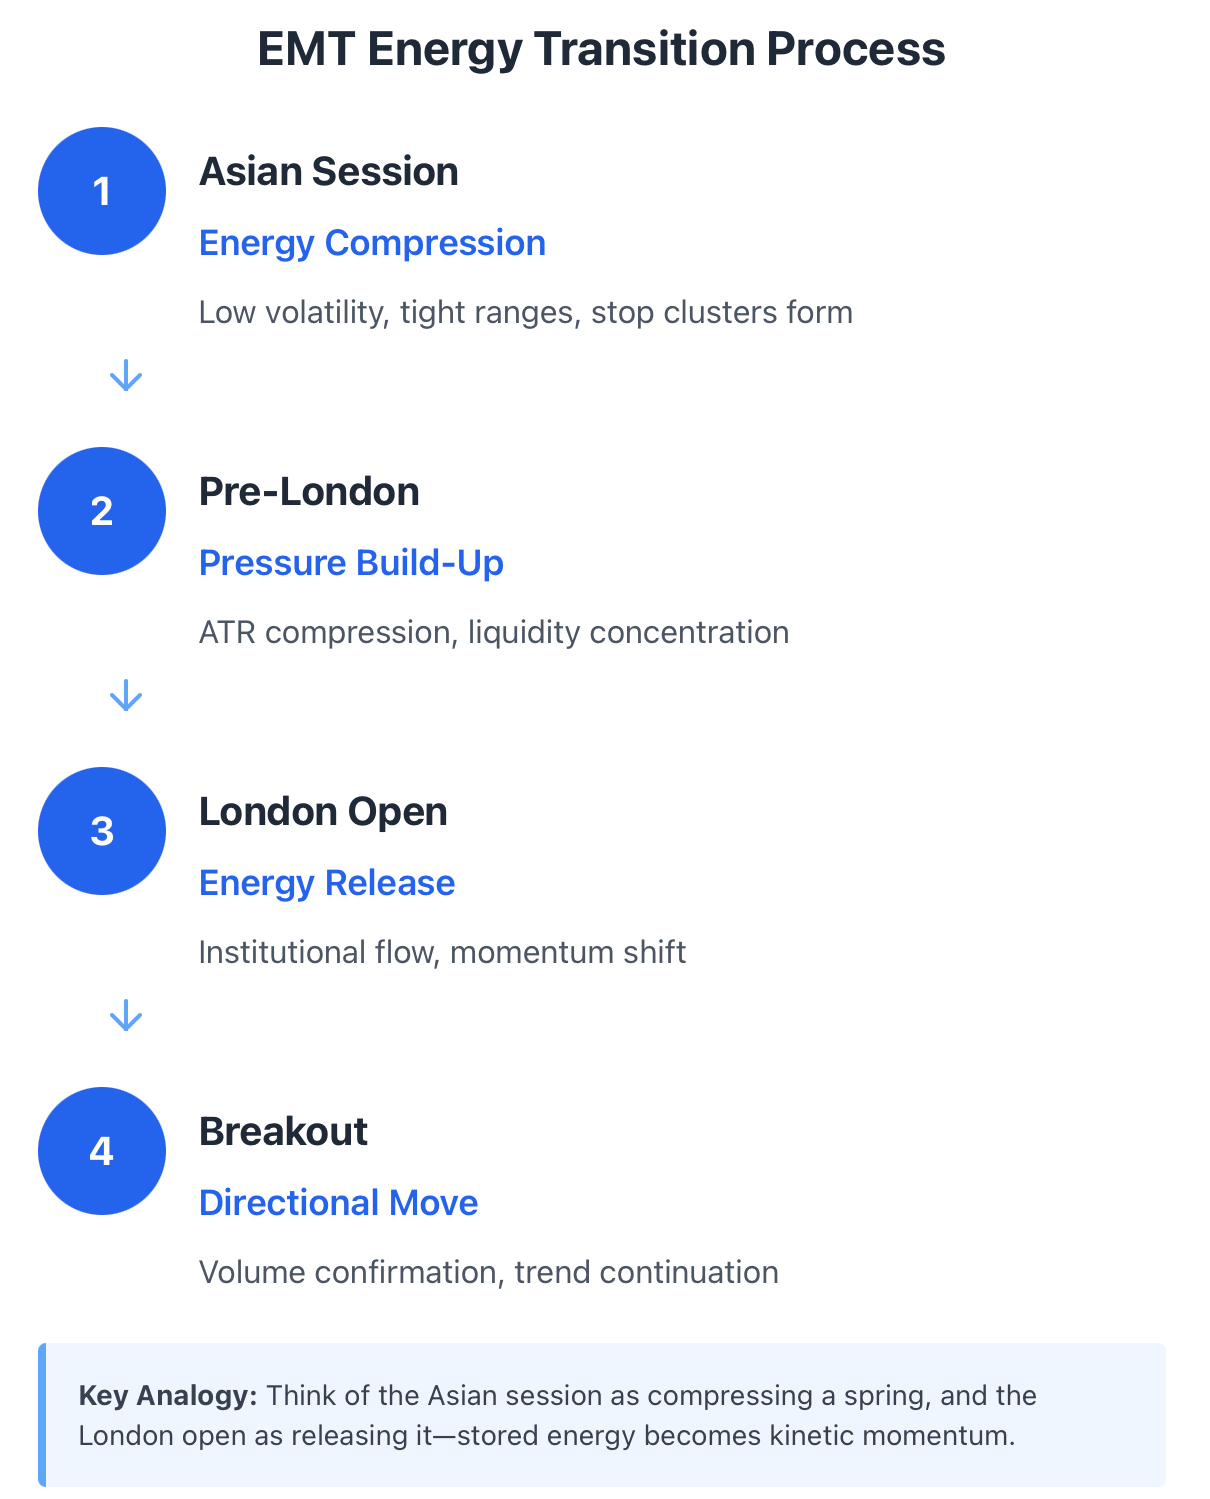
EMT (Energy Momentum Transition) Model: How to Spot "Calm-to-Explosion" Signals
In the following sections, we will discuss the specific frameworks used in the Asian Session and London Session, including their respective attributes as they pertain to different phases of market activity and energy. "Energy" and "Momentum" are both abstract concepts that serve as the basis for identifying how markets transition between low-energy (consolidation) and high-energy (breakout/trending) states.
The analogy of market energy to a "spring" can help clarify the concept. The Asian Session is analogous to a spring being compressed; as prices remain within a defined range, the volatility decreases, which creates downward pressure on pricing, causing the ATR indicator to fall. The London Session opening is analogous to the release of the spring, which converts stored market energy into directional price momentum.
Core Elements of EMT:
1. A.I.R. (Average Intraday Range) Compression
The ATR indicator measures volatility, and as the price remains within a defined range, the ATR values drop. A significant drop in ATR values indicates that a compression has occurred, or "coil tightening."
How to identify: Use an ATR indicator on M15 or H1 charts and monitor for a series of declining ATR values throughout the Asian hours.
2. Liquidity Concentration
Prices consolidating within a narrow range means that liquidity is consolidating as well and that liquidity is concentrated at specific price levels; prices will typically be within 50-70% of the previous day's range.
How to identify: Draw horizontal support and resistance lines based on the last 4-6 Asian Hours. If a price consistently remains within these levels, liquidity is being concentrated in those areas.
3. Momentum Shift
At 3:00 AM GMT+0, pay attention to momentum indicator crosses like the MACD, RSI breaking out of the mid-range, and momentum oscillators trending upwards from their previous levels; these are indications that energy is changing from potential energy to kinetic energy.
To detect these energy shifts, you'll want to monitor MACD using a 12/26/9 setting. When the MACD line crosses over the signal line and begins increasing in value right after 3:00 AM, that's validation of a momentum shift.
To validate breakouts, you should validate that not all volatility spikes are actual breakouts; you can do this:
-
Volume support - The breakout candle should be at least 1.5 times the average volume.
-
Follow through - The second candle after the breakout (when the candle closes above a certain price) should be in the same direction as the breakout.
-
No immediate price reversal - The price during the next 2 to 3 candles shouldn't close back under the breakout range after closing above.
-
ATR exponential - The ATR (average true range) should exceed its 20-period average.
Entry and Exit Rules for EMT -
Entry: Entry should occur on the first candle that closes above the Asian range after your EMT confirmation signals have aligned, or, if required, you can enter on a retest of that level down.
Exit - Your profit target will be 1.5 to 2 times the width of the Asian range, and/or you can trail your stop based on the respective ATR values.
If you're new to EMT, think about it as the earthquake tremors preceding the actual earthquake. The smaller signals you see mean that something larger is on its way. You won't be able to pinpoint when the actual event will occur; instead, you must prepare for it when it does happen.
If you're a professional trader, take full advantage of the pairing of EMT and order flow tools. When you see Cumulative Delta Divergence during Compression Phases, if the price remains stable but the delta continues to rise, you are witnessing a build-up of institutional purchases and increasing energy.
Complete EMT-Based Trading Template (Plug-and-Play for Traders)
Here's a full trading framework you can use starting today.
Strategy Workflow:
Step 1: Identify (Asian Session)
-
Mark the Asian session high and low (typically 12 AM - 8 AM GMT)
-
Calculate the range width in pips
-
Note any significant support/resistance levels within the range
-
Check ATR—is it compressing?
Step 2: Filter (Pre-London)
-
Check the economic calendar for high-impact news at the London open
-
Assess whether yesterday's price action was trending or ranging
-
Identify the dominant currency strength (use currency strength meters if available)
-
Set alerts for breaks above/below the Asian range
Step 3: Entry (London Open)
-
Wait for the first candle at London open (8 AM GMT)
-
If a breakout occurs with volume confirmation, enter on the close of the breakout candle or on the first pullback
-
If a false breakout occurs, wait for reversal confirmation and enter the opposite direction
-
If no clear signal, wait for pattern completion
Step 4: Management (Active Trading)
-
Set stop-loss at 1.2-1.5x the Asian range width
-
First profit target at 1.5x Asian range
-
Move stop to breakeven after 1x Asian range profit
-
Trail stop using 0.5x ATR if trend continues
Step 5: Exit
-
Full exit at 2x-3x Asian range or when momentum indicators diverge
-
Exit immediately if price closes back inside Asian range (failed breakout)
-
Exit before major news events if holding intraday
Suitable Currency Pairs:
EUR/USD, GBP/USD, EUR/GBP (best liquidity)
GBP/JPY, EUR/JPY (best volatility)
Recommended Timeframes:
-
M5 for scalping (quick in/out, tight stops)
-
M15 for standard day trading (balance of noise vs signal)
-
M30 for swing entries (fewer trades, higher win rate)
Trader-Level Strategy Guide
Different skill levels require different approaches. Here's how to tailor the overlap strategy to your experience.
Beginner Strategy: Simple Breakout
Don't try to predict direction. Just trade the breakout.
-
Wait for the London open
-
If price breaks above Asian high with strong volume, buy
-
If price breaks below Asian low with strong volume, sell
-
Stop-loss just inside the Asian range
-
Take profit at 1.5x the range width
-
Don't hold past 12 PM GMT
This approach removes guesswork. You're trading momentum, not forecasting. Your edge is statistical—breakouts succeed more often than they fail during this window.
Intermediate Strategy: Trend Continuation + ATR Filtering
Add context and filters to increase win rate.
-
Check the 4H and D1 charts for trend direction
-
Only trade London breakouts that align with higher timeframe trends
-
Use ATR filtering: only take trades when ATR is compressed below the 20-period average
-
Add a second confirmation: RSI breaking 50 in the direction of your trade
-
Scale out of positions: take 50% profit at 1.5x range, let 50% run with trailing stop
This approach combines directional bias with timing. You're stacking probabilities in your favor.
Professional Strategy: Order Flow + News + EMT Model
Integrate multiple data sources for institutional-level reads.
-
Monitor order flow using tools like footprint charts or cumulative delta
-
Cross-reference economic news calendars and positioning reports (COT data)
-
Use EMT signals (compression, liquidity concentration, momentum shift) to time entries
-
Layer in sentiment indicators: if retail is heavily long and stops are clustered above, expect a fake breakout down before the real move up
-
Manage multiple positions: one for quick scalps, one for intraday swings
-
Use correlation analysis: if EUR/USD breaks up but USD/CHF doesn't break down, question the breakout strength
This approach treats trading like a probability game where you're constantly updating your thesis based on new information.
8 Common Mistakes During Overlap and How to Avoid Losses
Even seasoned traders make these common mistakes during times of high volatility. Follow these tips to help you avoid making these mistakes.
1. Using High Leverage
High volatility magnifies both gains and losses. If you are using 50:1 or 100:1 during a period of high volatility and then encounter a bad spike, you can lose everything in a matter of seconds. Using 10:1 or lower is a safer alternative.
2. Widening Spreads
As soon as the London market opens, spreads may widen considerably (e.g. widen from 0.5 pips to 2-3 pips). When spreads are widened, they take away from your profits and can trigger your stop loss too early. When setting your stop loss, factor in spread costs.
3. Chasing the Trade
The first breakout candle occurs in rapid fashion. If you did not get the entry, do not chase it down. Wait for a pullback or for a new entry opportunity. Chasing the trade often results in poor entries and emotional trading.
4. Ignoring the News
High-impact news is abundant (PMI, unemployment, inflation data, etc.) during the London market. This high-impact news can often create a stronger influence over technical setups than the technical setup would have on the charts. Always look at your calendar for important news events prior to entering a trade.
5. Blindly Applying Asian Logic to the London Market
Strategies based on a range-bound market that work well in the Asian market will usually not work in the London market. Your trading strategy should be flexible enough to adapt to the changes in the market due to an increase in liquidity.
6. Neglecting Slippage
Neglecting the slippage factor when trading fast-moving markets is essential, as you also need to account for it in your risk calculations. Slippage should be taken into account in your risk calculation, as you may have an entry/exit price that is different from your original intended price due to fast movement.
7. Blind Range Breakout
Blindly assuming a range breakout is a good indicator for trading (without any volume validation) is often a mistake, as there are many times that a range breakout will fail because there was no volume confirmation.
8. Forgetting to Observe Order Book Structure
Observing the structure of the Order Book and utilising either the Level 2 or Volume Profile to see the price action of the order book is important. If you see large amounts of sell orders stacked above the current market price, this is often an indication that a breakout attempt is going to fail.
Risk Management Template: Protecting Capital During High-Volatility Sessions
Managing Volatility:
One of the most important factors to manage profit and loss in high volatility markets is to understand that increased volatility equates to an increase in risk. Therefore, here is how to manage the risk associated with increased volatility.
Stop-Loss Guidelines:
When placing stop-loss orders, set the stops at 1.2-1.5 times the size of the Asian range. This allows for a greater amount of breathing space for the trade while limiting the risk exposure to that level. For example, if the range of the Asian session was 20 pips, the stop-loss would be set between 24-30 pips.
Leverage Limits:
When trading during overlap periods (London Session), it is important to keep your leverage below 10:1. Even if your broker has a max leverage of 100:1, taking advantage of that level during high-volatility markets is gambling rather than trading.
Position Adjustment Before the Opening of the London Session:
Before the opening of the London Session, if you have remaining positions from the Asian Session, close them out or reduce your position size before the opening of London. The volatility spike could cause the market to move against your position and stop you out, only to have the market return to a price that is back into a position.
Avoiding Slippage:
Whenever possible, use limit orders for your entry and exit points. If you must use a market order, be prepared to accept that your order will be filled 1-2 pips higher than your stated entry point.
Monitoring Volatility:
Utilise the Average True Range (ATR) as an indicator of current volatility. If your ATR is at least twice as much as normal, then consider decreasing your position size in order to align with the increased volatility.
Implementing a Maximum Daily Loss Limit:
It would be ideal if you were to implement a 'hard stop' for daily losses. If you've encountered a loss of between 2 and 3 per cent of your total account balance in one trading day, you should stop trading for that day. An emotional need for "revenge" during times of high volatility will most likely lead to your account being blown up.
Minimising your Correlation Risk:
At the same time, it is very important that you don't trade more than one correlated currency pair at a time during times when they overlap (e.g., EUR/USD and GBP/USD). Taking both currency pairs into account will give you double the risk exposure without realising it. The above rules should not be considered optional, but rather the rules that will enable you to survive long enough to benefit from your trading edge.
6 Key Criteria for Choosing a Broker for Overlap Trading
There are many types of brokers, but many brokers do not have the systems in place to manage the increased volume of transactional activity associated with high-level overlapped opportunities. Brokers should possess the following capabilities:
1. Speed of Execution
When a new market opens, the movement of prices can occur within milliseconds. Thus, a broker must be able to execute your trades within no more than 50-100ms to avoid adverse effects such as slippage.
2. Spreads Smaller than 1 pip
Finding a broker that has a spread of less than 1 pip on major currency pairs during regular market conditions (before the effect of overlap) is vital, as is finding a broker that will provide less than a 2 pip spread on major currency pairs during spike volatility that occurs immediately following the London opening.
3. Consistent Liquidity
Brokers that use multiple liquidity providers will have more consistent pricing than single-provider brokers, which may see gaps and requotes on their trades during periods of high volatility. Always check your broker's execution statistics, as well as their client reviews, for further confirmation of their capabilities.
4. Support for Trading Around Major Events
Some brokers place restrictions on trading before, during, and after major news events, which may prevent you from fully maximising the opportunity provided by the overlap between markets. The best broker for this type of trading will allow you to trade normally during these time periods, without any excessive limitations.
5. Variety of Products Offered (Forex and CFD Trading)
As the overlap will affect several different products (forex, commodities, indices), it is best to work with a broker who offers you all the various forms of market products available to you to optimise your trading activity by taking advantage of multi-asset correlations between products.
6. Access to Market Data and Depth
Level 2 market data, volume indicators, and market depth analysis tools are essential components to reading the order flow. Many retail platforms do not provide retail traders with this information, so check with your broker to see if they can provide this data directly and/or allow integration with third-party charting providers.
Your selected broker is your partner, and selecting the wrong broker can be as detrimental to your trading results as making bad trading decisions.
Conclusion: Building Your Own Asian-London Session Trading System
The overlap of Asian and London trading sessions is not purely a coincidence; there's a predictable structure in the Forex Market, which generates inherent volatility. With an understanding of Asian and London Session EMT, you will have a framework for identifying when “quiet” markets will soon be heading into a trending move.
The Asian Trading Session accumulates potential energy from Consolidation (low liquidity) and builds potential markets through consolidation and accumulation between 5 a.m.-10 p.m. GMT. This momentum builds when the institutional market opens for business at the London Session at 8 a.m. GMT and unleashes that accumulation through institutional order flow and aggressive positioning.
According to the research, the volatility of the major currency pairs doubles and triples during the overlap period that occurs between the Asian and London sessions.
The common price patterns identified at this time are: “Fake Breakouts,” Continued Trends, and News-Induced Oscillations.
By understanding the signs of EMT (Compression), which indicate that you should be looking for a place to enter the market, an increase of liquidity, and a change of momentum, which will assist you in placing your trade.
Risk management during high volatility periods is not optional; it is a necessity for survival.
The next step is to implement what you have learned in your trading plan by using the template located in Section VIII of this book. You will want to forward test this trading plan on a demo account over a minimum of 20 trades. You will want to log your results for each trade so you can analyse the data and adjust your strategy accordingly.
The market rewards those traders who prepare for the future, not those who rely on luck, so please create your own system, test it, and improve.
Ready to trade with precision during the market's most volatile window? Open a live or demo account with a broker that supports serious overlap trading. Test your EMT strategy in real market conditions and see the difference that proper execution infrastructure makes.