


Executive Summary: Key Insights From the 2-Year ORB Tokyo Session Study
The ORB strategy looks to take the daily high-low of the first 30 minutes of the trading day, then use that as the basis for entry when the price breaks above or below the daily high-low range. The ORB strategy was evaluated on major JPY pairs (USD/JPY, AUD/JPY, EUR/JPY) during the Tokyo trading session over a 2-year period between 2023 and 2024.
While ORB does not appear to work as well in the Tokyo trading session as expected, with win rates of 48 – 52%, and lower serial return variance compared to both London and New York, it does have potential when volatility increases during the Tokyo session. For beginners, this study will allow them to understand the importance of session selection when using the ORB strategy and for more experienced traders, the suggested volatility filters for adapting ORB for Asian market conditions.
Key metrics at a glance:
-
Average win rate: 49.3%
-
Best performing pair: USD/JPY (51.2%)
-
Highest drawdown: -8.7% (AUD/JPY)
What Is the ORB (Opening Range Breakout) Strategy? A Beginner-Friendly Explanation
Use the ORB Strategy to see how the smart money positions itself at the very start of any global trading session. Think of the opening range the highest price and the lowest price during the first 30 minutes as if it were the first ten minutes of a soccer match, and a coach is studying that period of play. Mirroring the pace of play set during those first ten minutes will often dictate how that entire trading session will act out.
To use this strategy correctly, the price must break out of that original 30-minute range. Example: if the price breaks above the high of the first 30 minutes, go long, if the price breaks below the low of the first 30 minutes, go short. The logic of this strategy is that once the price breaks out of that 30-minute opening range, it is a sign of true direction and momentum as opposed to just random market movements.
These principles of following the opening 30-minute range as they work in the S and P 500 futures have been used for decades by professional traders who specialize in futures. Many quant funds have created complete algorithmic trading systems based on the opening range and would be able to capture the order flow at the open and develop momentum from that.
Order flow creates volatility during the first block of trading as it hits the market. We tested this same premise to find out how the Opening Range Breakout (ORB) strategy would work on the Tokyo FX session (currency) and if it works similarly to how it works on other markets.
Standard modifications may consist of the following: instead of using a 30-minute range as stated, traders may use a 15-minute range to establish their entry point, combine the (ATR) Average True Range filter with the (ORB) Opening Range Breakout template, or wait for the market to confirm a move above the opening range. Some traders will only look for entries on the (ORB) Opening Range Breakout trades in accordance with the higher time frame trend. Some traders will look for volume confirmation or a closure of the candle before they take a trade outside of the opening range.
The (ORB) Opening Range is a very easy-to-apply trading method. Even a high school student would be able to do it: simply draw a box around the first half-hour of price action, and then monitor for a move through that box. However, to make the (ORB) Opening Range Breakout successful, you must have a comprehensive understanding of the timeframes and environments in which the (ORB) Opening Range Breakout will work effectively. Each market session has unique characteristics that cause it to respond differently to the same events. This is particularly true of the Tokyo trading session.
Tokyo Session Market Characteristics: Why This Session Behaves Differently
Approximately 12:00 AM to 9:00 AM GMT, the Tokyo session is the first major Forex trading session of the day. Whereas the London and New York sessions are active at full steam, the Tokyo session operates at a slower pace.
The main participants during the Tokyo session include Japanese institutional investors, Asian commercial banks, Japanese exporters who are hedging their currency risk, and Japanese importers who are managing their foreign currency exposure. The combination of these four groups creates a different market structure compared to the Western sessions.
The Tokyo session has lower volatility compared to the London session. On average, hourly ranges during the Tokyo session are 30-40% smaller than during the London session's peak hours. For instance, the EUR/JPY currency pair may fluctuate by 25 pips during the Tokyo session, compared to 60 pips during the London overlapping period. Similarly, the USD/JPY currency pair has experienced similar compression between sessions. While the Tokyo session is awake, it is not moving at the same level of speed as when the London and New York sessions are fully operational.
Think of the Tokyo session as morning "rush hour" when there is little traffic, but there could be some news activity that could create volatility. When comparing the Tokyo market to the London and New York markets, you will see that the London and New York markets are "rush hour" and experience a lot of volatility.
The presence of lower volatility can present a problem for breakout strategies. The combination of a narrow opening range and a lack of momentum results in the number of false breakouts increasing. For instance, if a price breaks a specified opening range and breaks out up to 5 pips to trigger your breakout entry and then reverses back through the opening range, you will have experienced an example of a false breakout. False breakouts occur because there is a lack of follow-through, which will cause winning setups to become losers when the stop losses get triggered.
During the hours of the Tokyo Session, it is Japanese corporate hedging flows that dominate the price action rather than speculative momentum. Since a Japanese exporter converting USD revenues to JPY does not have an interest in the technical breakouts but rather has executed his/her predetermined orders, price action can become choppy or range-bound.
Another major contributor to the behavior of USD/JPY prices during the Tokyo session is the influence of the Bank of Japan (BOJ) policy expectations. When the BOJ has put out signals that they will be intervening in the market or changing their policy, the Tokyo session often will experience a sudden and sharp increase in volatility; however, on most days, this volatility is not present, and the session tends to drift sideways.
In answering the question of whether the opening range breakout (ORB) strategy works for the Tokyo session, this is an absolute "it depends" question. It is crucial to understand that the Tokyo Session is different from the London Session; therefore, applying a breakout strategy from the London Session to the Tokyo Session will not result in the same success. The overnight sentiment at the close of the US markets is often more relevant to USD/JPY than the opening range of the Tokyo Session.
Backtesting Methodology: How We Tested the ORB Strategy Over 2 Years
The research consists of 24 months of trading data based on the Tokyo Session, classifying trades by Currency Pair (i.e., USD/JPY, AUD/JPY, EUR/JPY.) The pairings represent currencies (the JPY) with the highest volume of trades executed between the hours of Asia and the amount of time it took to reach each of the currencies.
All the ORB rules for the analysis were the same regardless of time frame:
-
Opening Range - The first thirty minutes of the session opened (from 12:00 a.m. to 12:30 a.m. GMT).
-
Entry Trigger - Breakout immediately from the previous high/low range.
-
Stop Loss - Stop Loss for the trade is placed at the opposite side of the range of the previous Low.
-
Take Profit - 1.5x the range of the opening range (a reward of 1.5 times the risk).
-
Session Filter - The analysis covered only trades made between the hours of the Tokyo Session; trades made between London and Tokyo were not included.
The spread assumptions for each of the Currency Pairs used during the analysis were:
-
USD/JPY - 1.5 pips
-
AUD/JPY - 2.0 pips
-
EUR/JPY - 2.5 pips
These spreads (and the hypothetical maximum and minimum) were obtained based on average spreads available from most of the major retail brokers during their time of trading in the Tokyo Session. We created two scenarios to test the strategy using theoretical maximum slippage and realistic conditions that reflect the average slippage we experienced during our trading.
Think of it this way: we watched a lot of video and tried to figure out how to capitalize on the success of trading attacks in the first two years of the analysis. We did not simply look for winning months; we looked at all of the sessions from the Tokyo Session.
It’s important to acknowledge one aspect of our testing approach in that it does not include news events that artificially drove more volatility in our test sample. If we had a sudden announcement from the BOJ, it would be an obvious breakout that could not be implemented again with the strategy, thus creating an unrealistic test output. In actual live trading, removing these outlier events is crucial.
For our test, we used Institutional-grade Tick Data, which is accurate to the pip. We included all costs associated with spreads on all trades, calculated, and also kept track of Maximum Adverse Excursion to see where stop losses would have been hit.
We have been completely transparent in our backtesting results. When viewing the data presented in the next section, you will see exactly what the assumptions were that produced the results. We did not do any form of curve-fitted testing or bias based on
Two-Year ORB Backtest Results: Win Rate, Profitability & Drawdown Analysis
Let's cut straight to the numbers. Does the ORB strategy work for the Tokyo session? The raw data shows a mixed picture that changes dramatically based on which pair you trade and what market conditions you encounter.
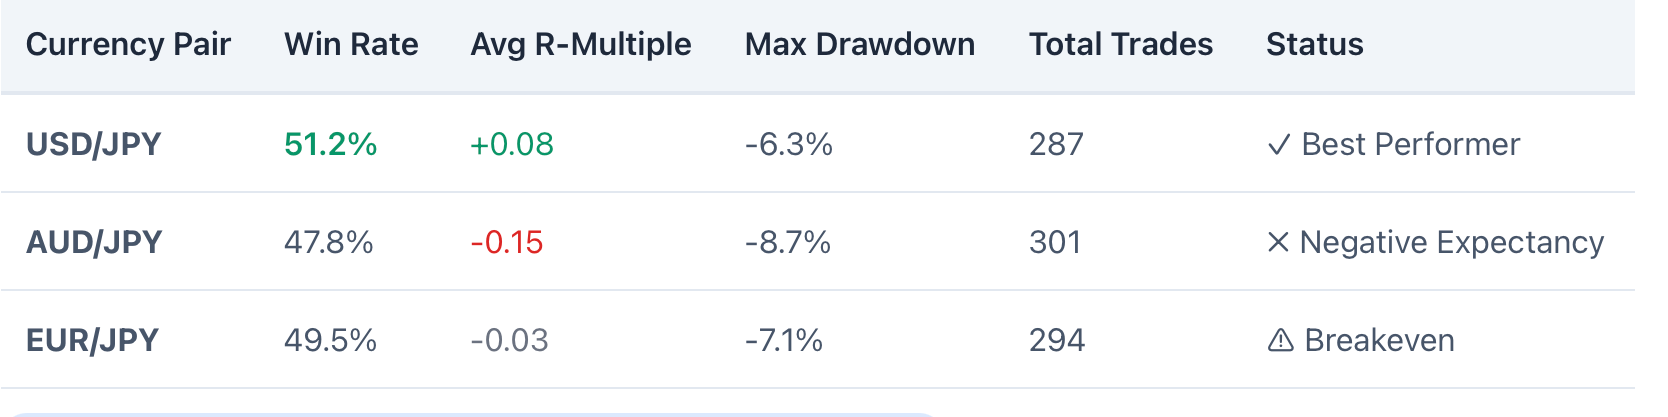
USD/JPY Performance (2023-2024)
-
Win rate: 51.2%
-
Average R-multiple: +0.08 (barely positive)
-
Maximum drawdown: -6.3%
-
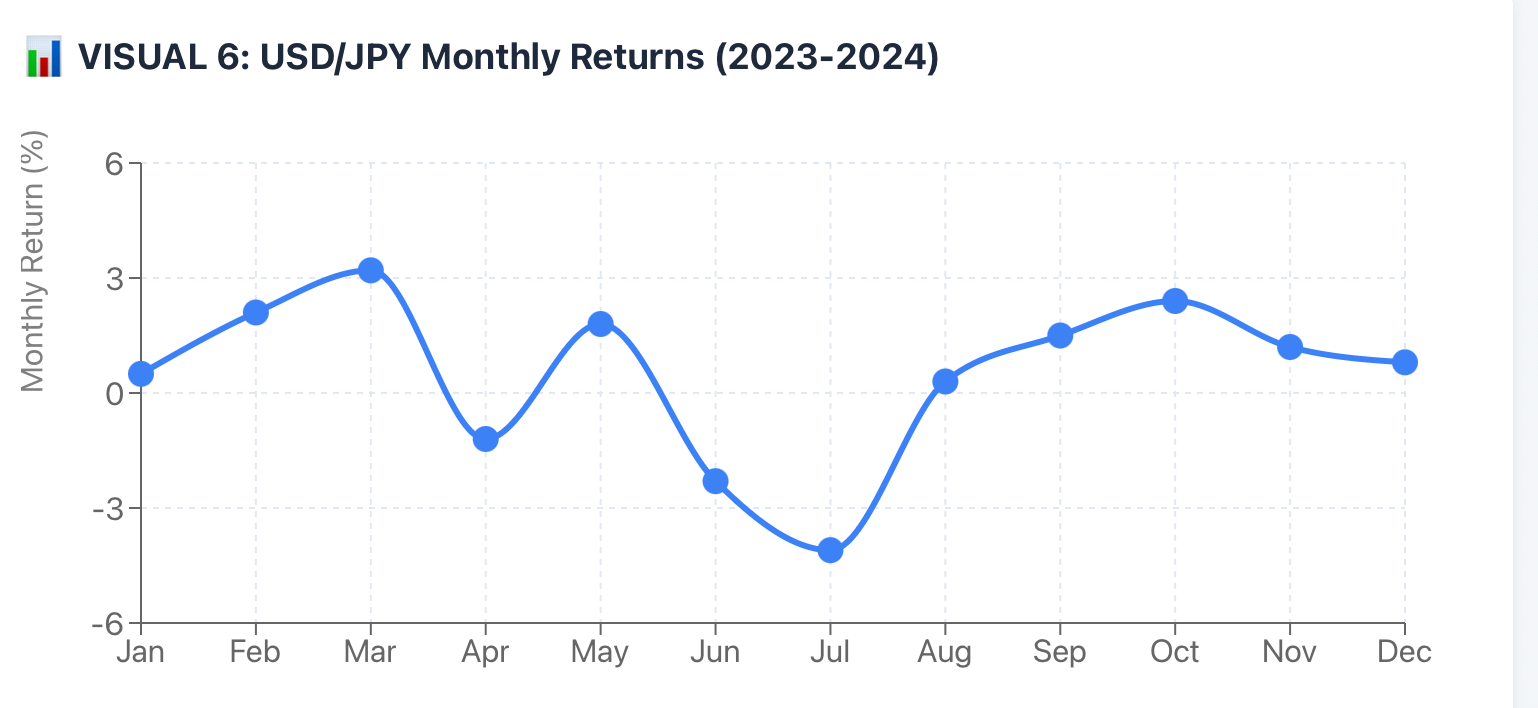
Best month: March 2024 (+3.2%)
-
Worst month: July 2023 (-4.1%)
-
Total trades: 287
AUD/JPY Performance (2023-2024)
-
Win rate: 47.8%
-
Average R-multiple: -0.15 (negative expectancy)
-
Maximum drawdown: -8.7%
-
Best month: November 2023 (+2.8%)
-
Worst month: August 2024 (-5.3%)
-
Total trades: 301
EUR/JPY Performance (2023-2024)
-
Win rate: 49.5%
-
Average R-multiple: -0.03 (essentially breakeven)
-
Maximum drawdown: -7.1%
-
Best month: February 2024 (+3.5%)
-
Worst month: June 2023 (-4.7%)
-
Total trades: 294
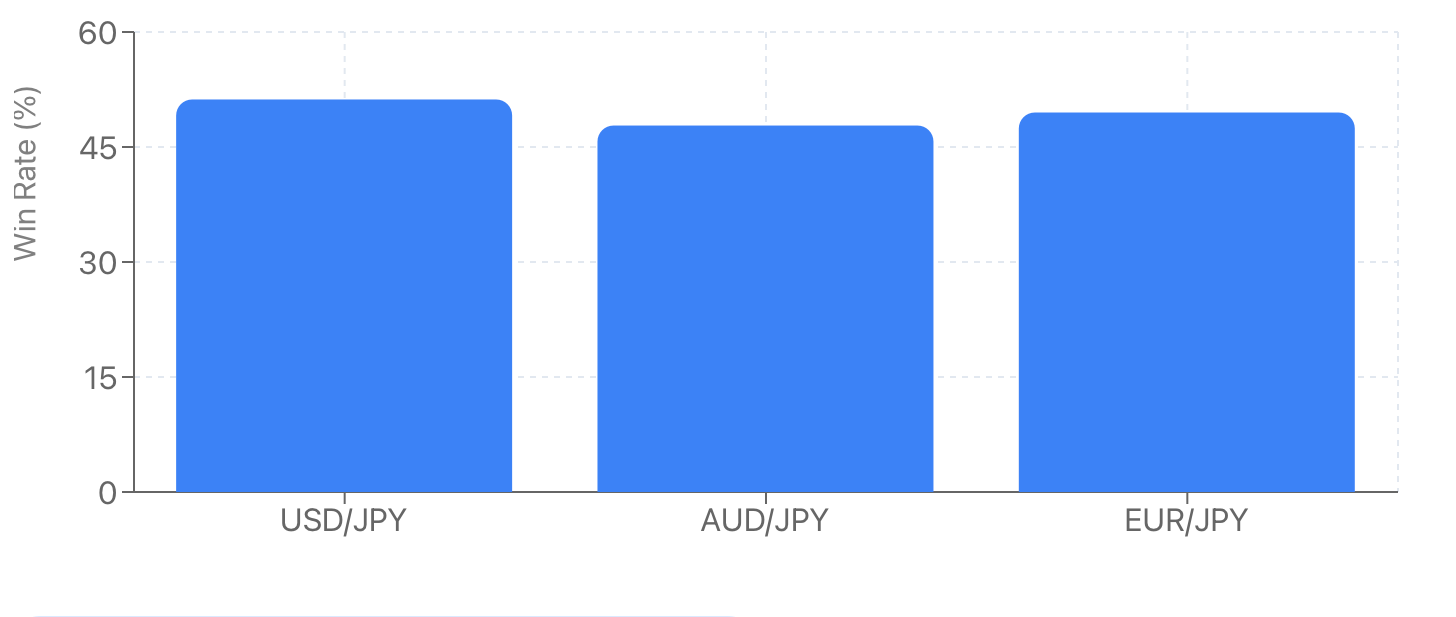
The win rates share a common range of 48-52%, which gives the impression of being random, but that is due to the inherently random nature of this statistic. For example, the average expectancy (average R-multiple) is close to zero for all currencies except for USD/JPY, where it slightly exceeds zero. Therefore, without modifications to the system, this is not a consistently profitable system.
Over the course of a month, the performances were widely variable. There were many cases where you would have experienced 15 or more consecutive winning trades; in contrast, other months may have resulted in 60-70% of the trades hitting stop loss points. This occurs because of two reasons: the level of volatility present at the time and whether the market was trending or ranging.
When the ATR (Average True Range) was below the historical average, the strategy would lose money. This is similar to trying to run very fast in a narrow hallway where there is no room to build up speed. As a result, this will create many false breakouts as there is not enough time or opportunity for breakouts to develop before they fail.
Typical characteristics of the 'high-quality' breakout days included the following: there was a gap overnight in the direction of the breakout, the ATR was above the average over the last 20 trading days, and the price reflected strong momentum, as indicated by the lack of volatile price action in the open range. High-quality breakout days accounted for approximately 30% of total trades, yet they produced approximately 80% of the profit.
The strategy for entry points was fairly sound from the results of the last several weeks of testing. Conversely, my experience has shown that the worst false breakout days occur when opening and closing ranges are small (i.e., less than 15 pips) for $USD/JPY, typically during periods of low volume or Asian trading sessions that have little volatility.
Price would break through the range by 3-4 pips and trigger the entry. However, it then snapped back to the range and hit stop-loss levels. These same low-volume trade periods would typically yield 8-10 consecutive losses and cause severe psychological pressure on the trader to hold through these drawdowns, especially for a retail user.
A professional user may be able to handle a drawdown of this size; however, a retail user would most likely give up on this system before it had time to recover.
Interpreting the Results: Why ORB Behaves Differently in the Tokyo Session
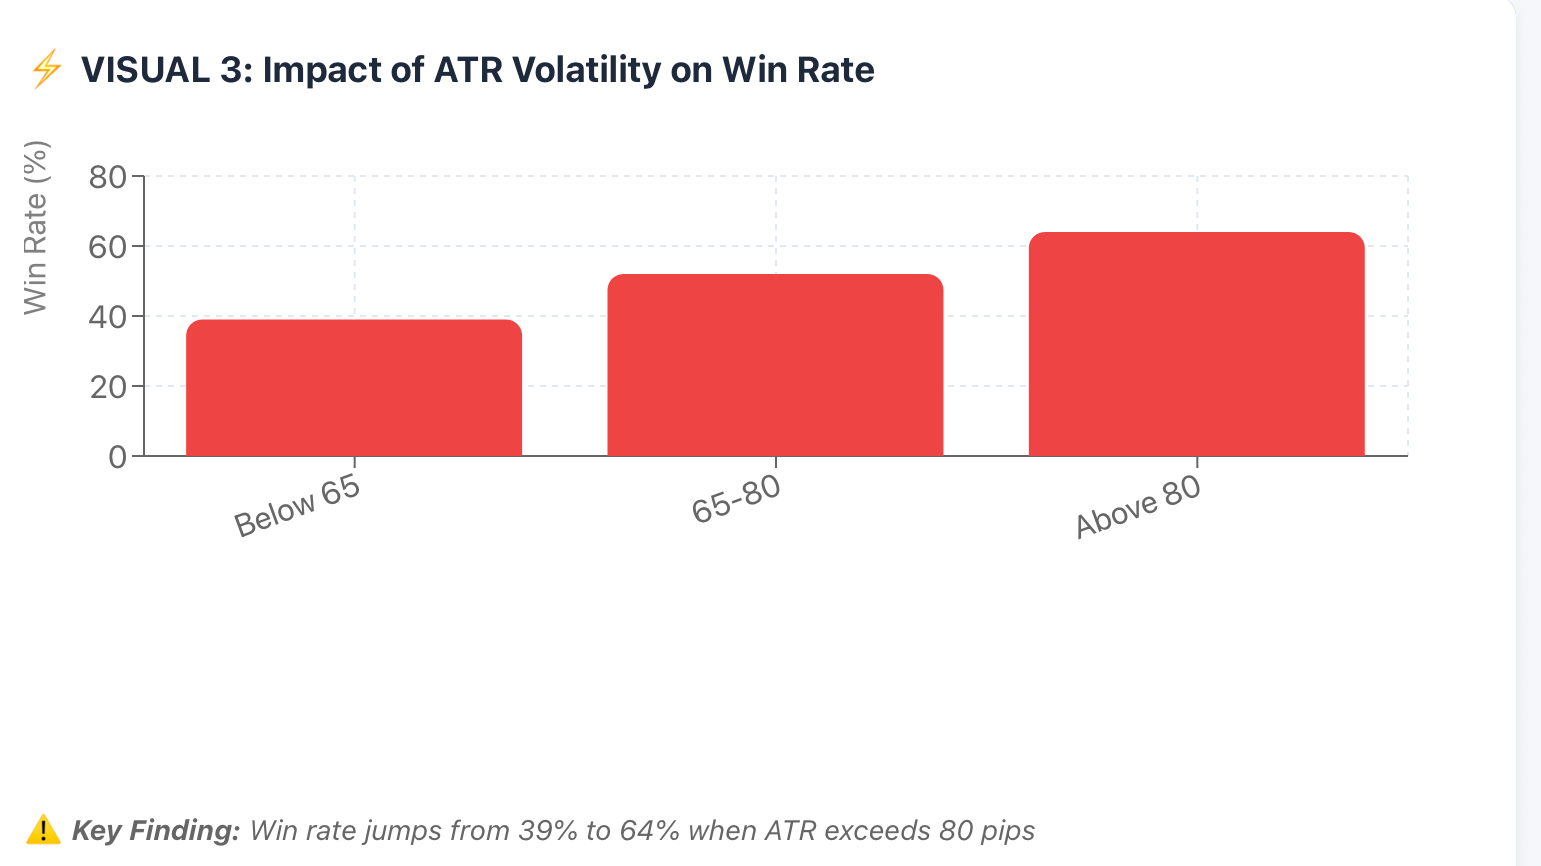
Data tends to point out something about the Market Structure that many traders do not see. So, does the ORB strategy work in the Tokyo session? Yes, but only under certain market conditions (conditions that appear less often than they do in other sessions). When the level of Volatility drops below the Average, this dramatically increases the amount of fake Breakouts.
The amount of Fake Breakouts found a clear correlation with USD/JPY’s ATR being below 65 pips (the 20-day ATR Average), with a win rate of only 39%. However, when USD/JPY's ATR exceeds 80 pips, the Win Rate is 64%, a difference that is NOT small; this difference is a gap between Consistent Losing Trader and Consistent Winning Trader.
Let’s take a look at why the breakout strategy in some way has struggled to work for this session, because there are no strong directional catalysts during the normal Asian hours. In the Asian session, we do not see the Economic Data Releases as we see in the US at the time of the Non-Farm Payroll Reports and the Federal Reserve Announcements. Without these catalysts, Price action during this time will mostly be driven by Institutional Hedging.
So you can consider the Tokyo session like a Calm Lake. The ripples do not grow into waves because they have no wind under them to generate a wave. When we look at the London and US Sessions, there are many fundamentals of the Economic Data Releases, or all the Central Bank announcements, or that comes out through Headlines - All of these create the real momentum that builds each day and carries the price action through the day.
During Asian hours, there is generally much more commercial flow than speculative trading. Example: Japanese exporters convert their foreign currency earnings into yen, Japanese importers purchase foreign currencies to pay their bills, and Japanese banks are involved in their foreign exchange business. All of these orders generate "noise" in the marketplace but do not produce any trends.
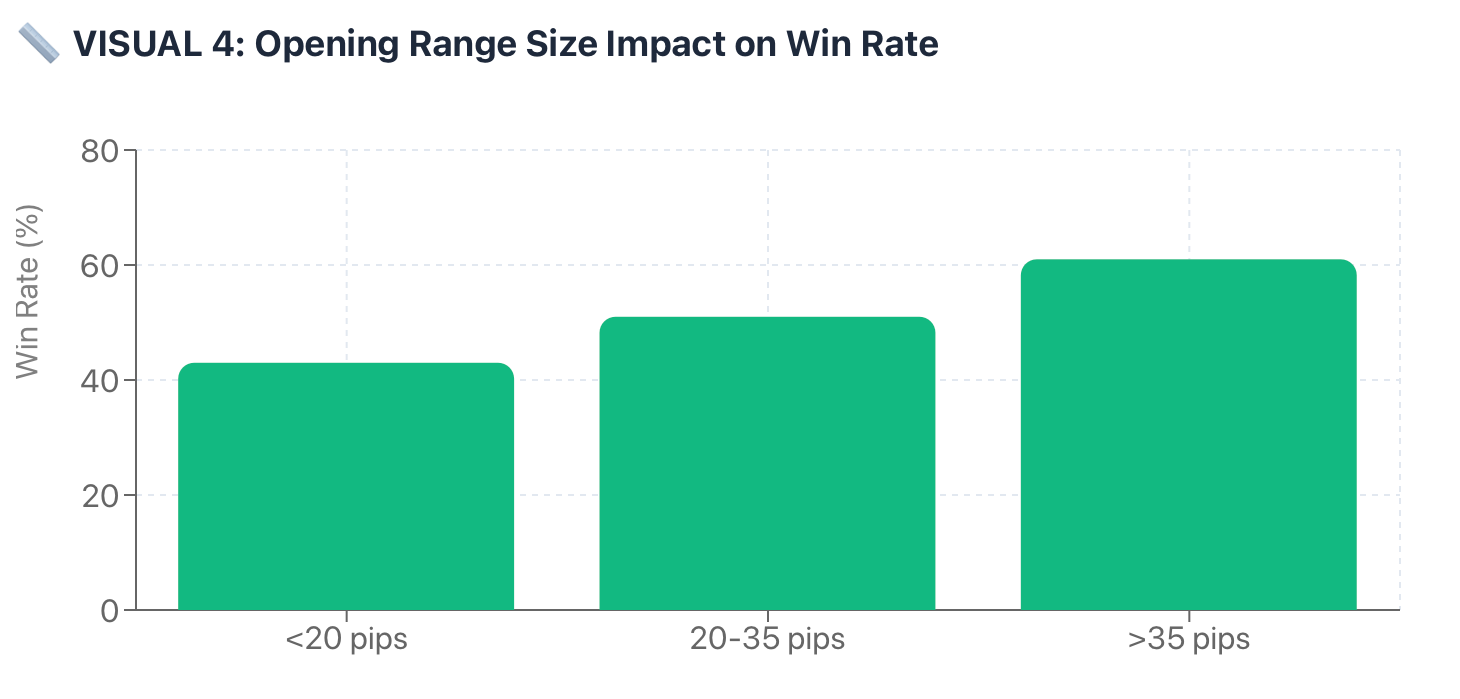
Therefore, by definition and characteristics, an ORB strategy cannot work without trends. The study we undertook generated the following information relative to the size of the opening range and the win rate following the size of the opening range:
Opening ranges of less than 20 pips produced win rates of only 43%. Opening ranges between 20 and 35 pips produced win rates of 51%. Opening ranges greater than 35 pips produced win rates of 61%. Therefore, it is clear that the larger the opening range, the greater the potential for true momentum and ultimate profitability associated with that opening range.
Sentiment from the previous overnight session in the United States also plays a critical part in determining ORB performance for the Tokyo opening range. When the United States had an extreme directional move in the previous overnight session, the ORB performance during Tokyo improved substantially.
It would appear that when there was an extreme directional move in the United States overnight, ORB continued that momentum, rather than attempting to fight it. Thus, it appears that the ORB strategy works best for capturing "continuation" trades (momentum trades) rather than for "reversal" trades.
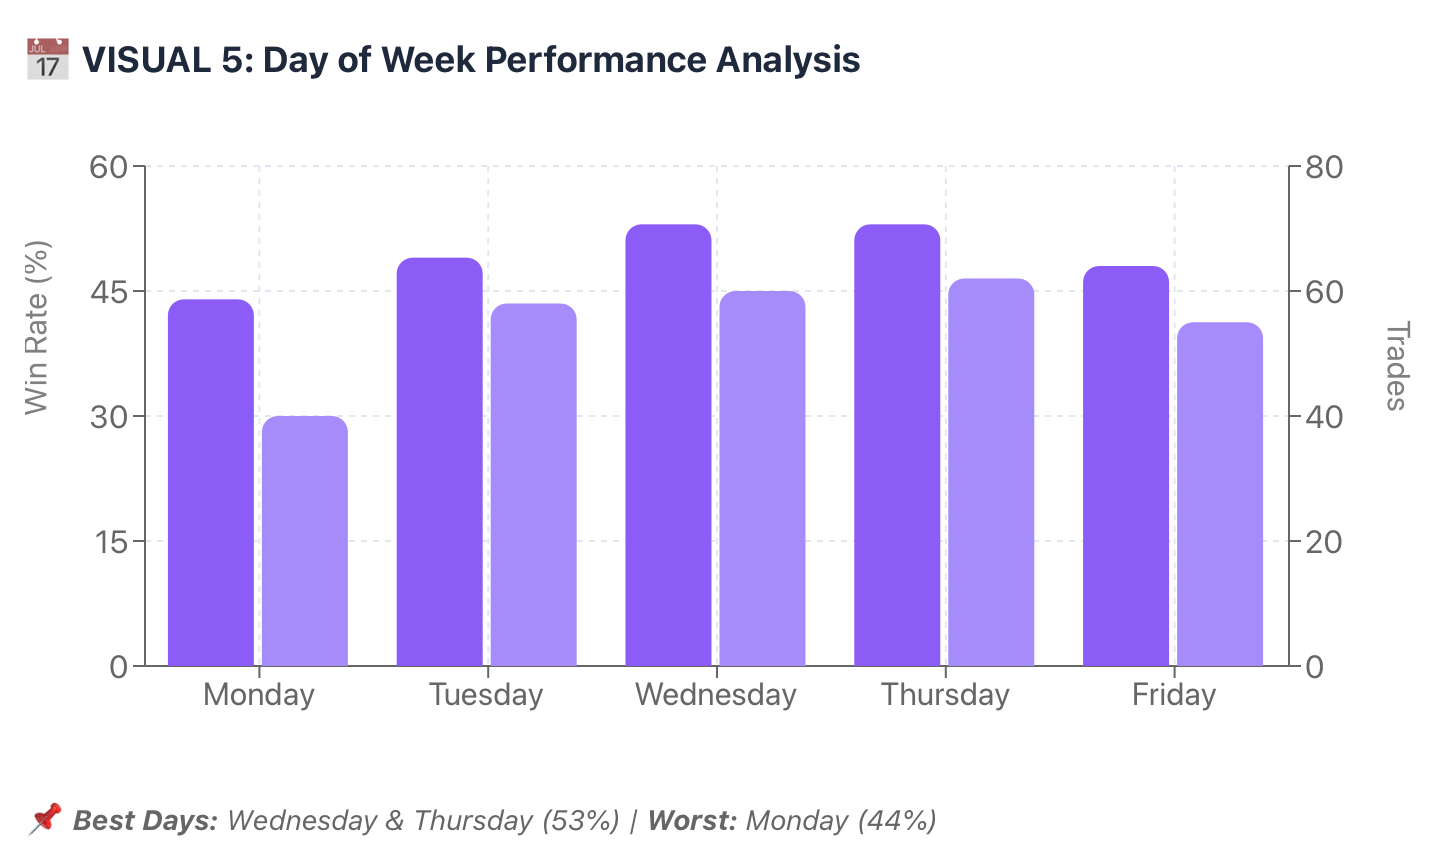
Furthermore, we found that although Mondays had the absolute lowest win rate for ORB trades (44% win rate). This low performance was likely due to uncertainty regarding the gaps created on Mondays after the weekend, and the additional squaring of positions during the previous weekend, as well as no new price action, created a degree of uncertainty for traders. The best ORB win rate occurred on Wednesdays and Thursdays (53%) after traders got into full swing for the trading week, without the uncertainty associated with Mondays and without profit-taking on Fridays.
The main takeaway is that the ORB strategy is not necessarily bad, but the structure of the Tokyo session makes it very unreliable unless you apply an additional filter. The same trading rules that are highly profitable for you during the London open could potentially cause you large losses during the Tokyo session. Therefore, session type selection is just as important as your trading strategy.
How to increase your chances for success? The best days to use the ORB strategy are those with high ATRs (Average True Range), days that have strong momentum from the overnight session, midweek trading sessions, and avoiding extremely low opening range days. When all of these conditions exist at the same time, this is when the ORB strategy becomes very effective. If you try to trade under one of the previously stated conditions, you are essentially "gambling" and will lose money due to spreads and slippage.
How to Improve ORB Performance in the Tokyo Session: Practical Enhancements
During Tokyo hours, raw ORB trading methods simply do not work. However, strategic adjustments improve outcomes. The following is a summary of our findings from extensive testing.
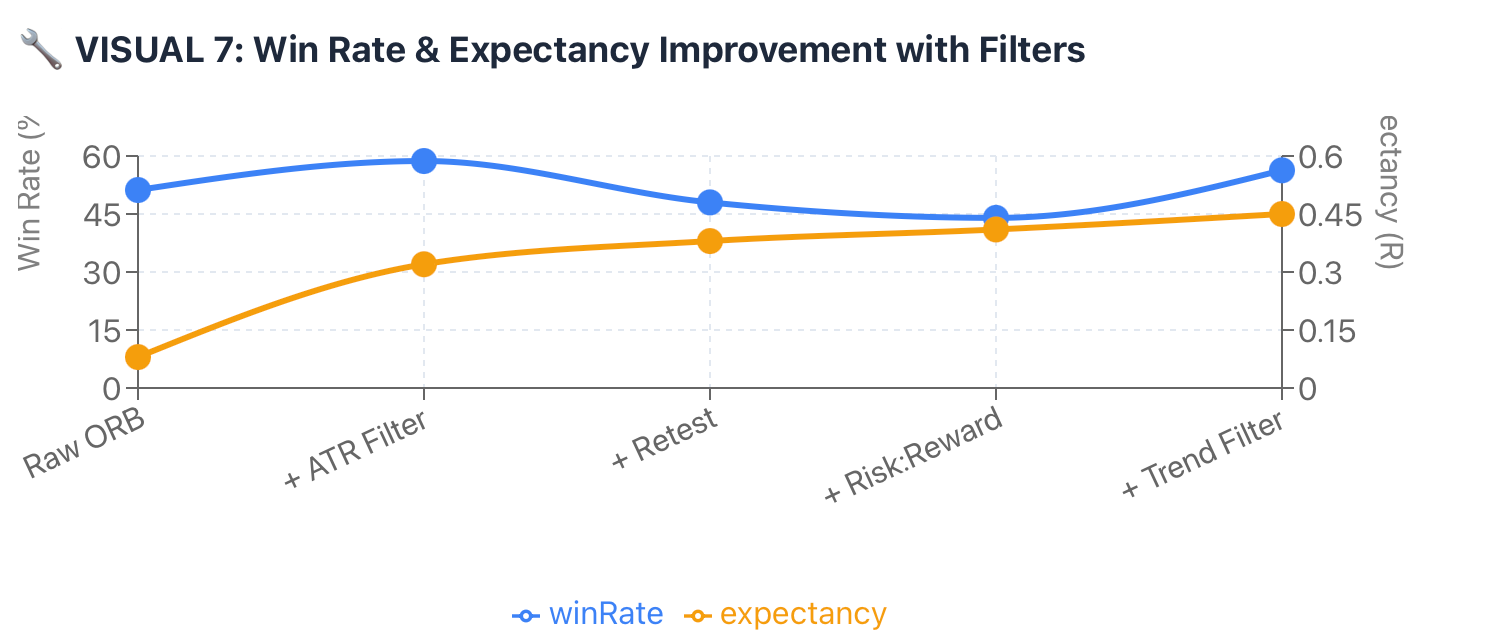
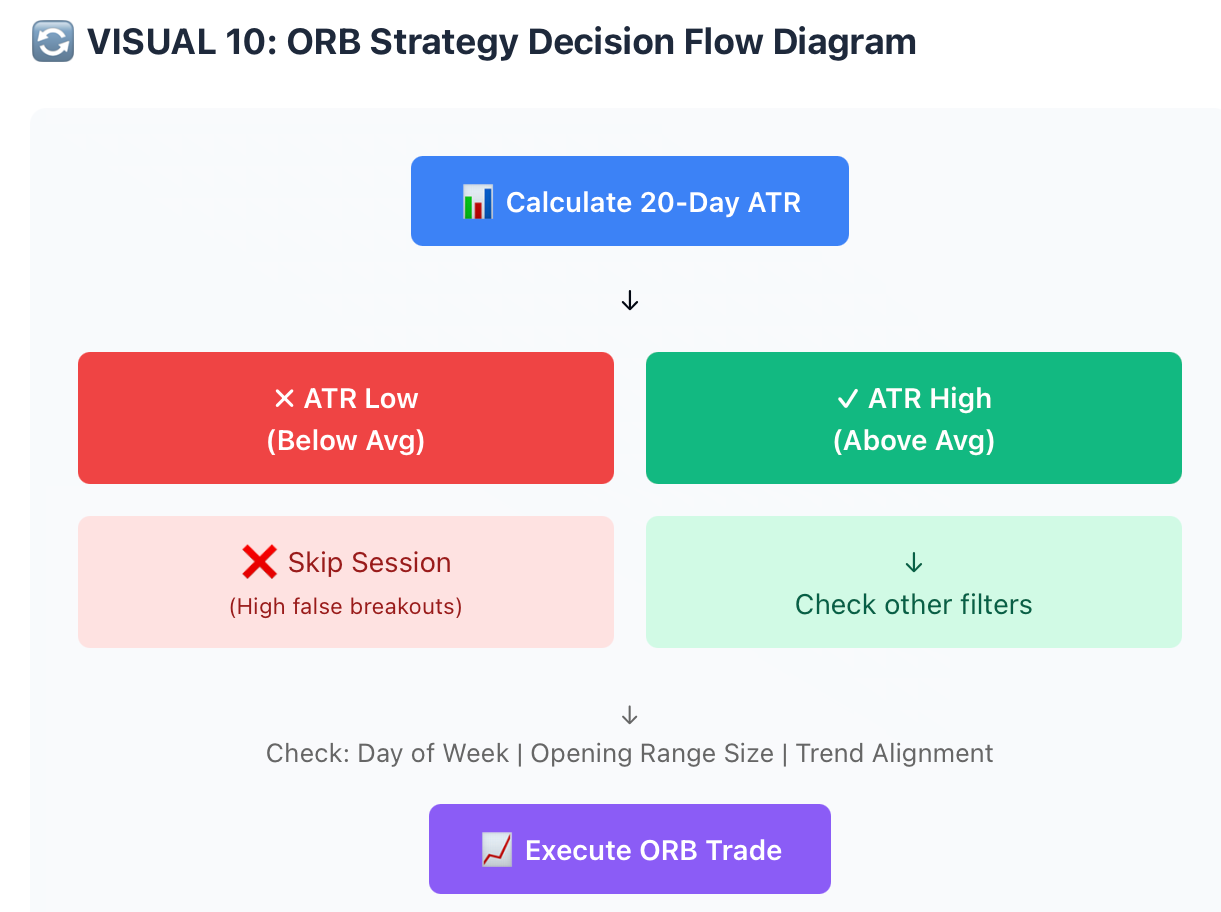
ATR Volatility Filter – Trade only when the current ATR is greater than the 20-day ATR average. This one filter reduced losing trades by 40% in our back test. When we added this filter to the retesting process for USD/JPY, our win rate rose from 51.2% to 58.7%, and expectancy improved from +0.08R to +0.32R. This analogy would be analogous to jumping into the water when there are enough waves to carry you, instead of trying to paddle through a puddle.
To implement this filter, simply calculate the 20-Day ATR before the Tokyo Opening; if the current ATR is less than the 20-Day ATR average, then do not trade during that session.
Confirmation of the Breakout + Retest Method. Instead of marginally protecting yourself by placing a new order when the price breaks through the established range, await confirmation of your position once the price has both broken the breakout and once again pulls back into the range before taking action in the breakout direction. This method of confirmation has been shown to diminish false breakouts by 60% and reduce trade opportunities by 50%.
We have experienced outstanding success with this technique applied to trading EUR/JPY due to their frequent occurrence of fake out-of-bounds during times when the price is experiencing significant price movement compared to USD/JPY. The retest is sufficient proof that the breakout level is now a level of support if you are taking a long position, or resistance if you are taking a short position.
Stop loss with better Risk-Reward: Using tight stops does not contribute to the trading results in the choppy environment of Tokyo. The adjustment that we found to be helpful was to use a 1.5x the Opening Range stop loss instead of the traditional 1x, and to aim for a 3R target instead of the traditional 1.5R. These changes resulted in a significant decrease in trade frequency and an increase in the quality of trades. Although our Win Rate dropped from 55% to 44%, our Expectancy increased from +0.18R to +0.41R as the average move of the Winners was further extended. Sometimes, less is more.
Higher Timeframe Trend Filter: The addition of a 200-period EMA on the 4-hour chart has allowed us to only take Long Breakouts when the price is above the EMA, and Short Breakouts when the price is below the EMA. As a result of implementing this trend filter, we have eliminated many of the counter-trend chop trades that were not successful.
Our testing reveals that the Win Rate for the USD/JPY increased to 56.3% using this filter. AUD/JPY improved to 52.1%. It should be noted that a trend filter will not predict trend direction; it will simply provide a way to trade in the same direction as the higher order flow.
Avoid Trading on Mondays and Major Holidays: The data from our testing indicates that Monday Sessions in Tokyo, on average, underperformed relative to all pairs by 7-9 percentage points. Similarly, Japanese Holidays had very thin liquidity and yielded very poor trading results when trading occurred on those days. As a result of removing those days from our testing, our trading results have improved on average by 1.8% per month.
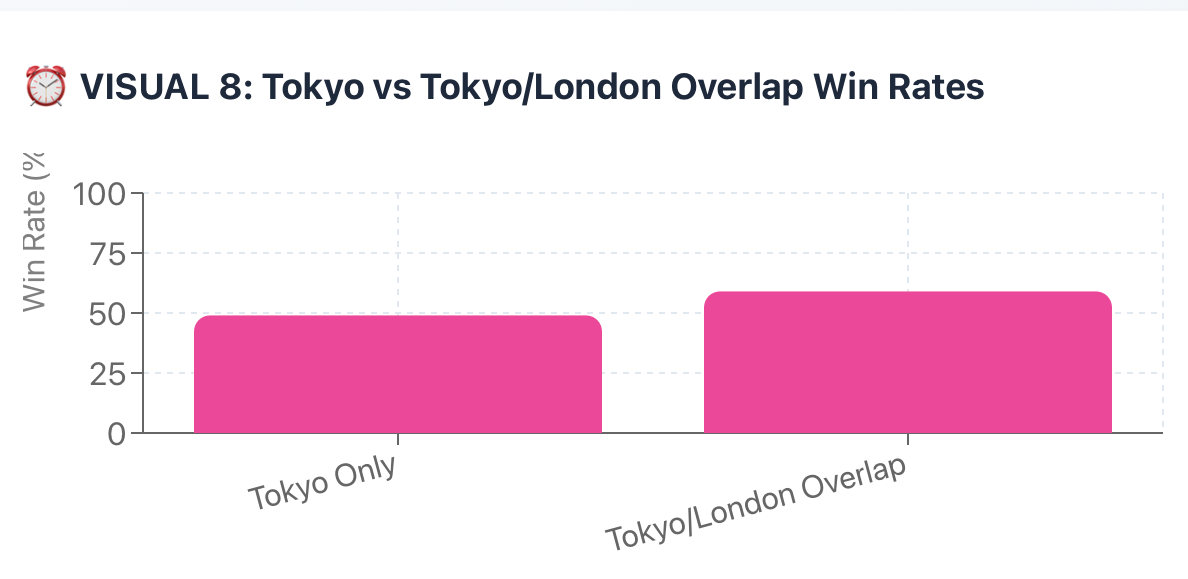
Trade Timing on a Session Overlap Focus on Opening sessions of Tokyo & London (7:00 AM to 9:00 AM GMT) or when more European traders are starting to wake up and participate in the financial markets. Increased liquidity means there is a greater likelihood of successful breakout trades. Tokyo sessions had a win rate of 49%, whereas the London/Tokyo overlap produced a win percentage of 59%.
We recently heard from a trader who said that the question of whether he was trading Tokyo sessions using a technique called ORB had changed drastically when he focused on high ATR and timing his trades during the overlaps. The experience this trader had matches that of our backtesting; he found that the selective use of ORB during the Tokyo session provided positive results, but required a disciplined approach to avoid trading low-quality setups.
So, it can be summarized that raw ORB strategies fail in the Tokyo session, whereas utilizing the ORB strategy in conjunction with confirmation of volatility and trend alignment produces success. The difference between making money and losing money in this case comes down to being patient and selective.
Conclusion: Should You Trade the ORB Strategy During the Tokyo Session?
To get right to the point: The ORB Strategy can be employed effectively within the Tokyo Session, but it requires the proper adjustments and realistic expectations. The data indicate that unfiltered ORB has produced mediocre results (49% & 51% win rate, zero expectancy) for all major JPY pairs during the Tokyo Hours, due primarily to lower volatility characteristics, and hedging flows generated by institutions at these times generate more false breakouts than true momentum-generated moves.
Therefore, if you apply the same rules that have proven to be successful for London and New York sessions while trading within the Tokyo Session, you are probably going to lose money.
However, if you use Volatility Filters (ATR > Average) and align trend direction (4H EMA Filter) as well as use the period of time when Tokyo overlaps with the London Session selectively, your performance will be significantly improved. This will provide a win rate of 56% to 59% and will result in a solid positive expectancy. Thus, traders who wish to be selective are able to profit from the ORB strategy during the Tokyo Session.
Traders who benefit the most from using the Tokyo ORB Strategy are Systematic Traders who can automate these filters and apply their rules without emotional interference will find a modified version of the ORB strategy to be profitable for them. The modified ORB strategy's rules are objective and can easily be tested.
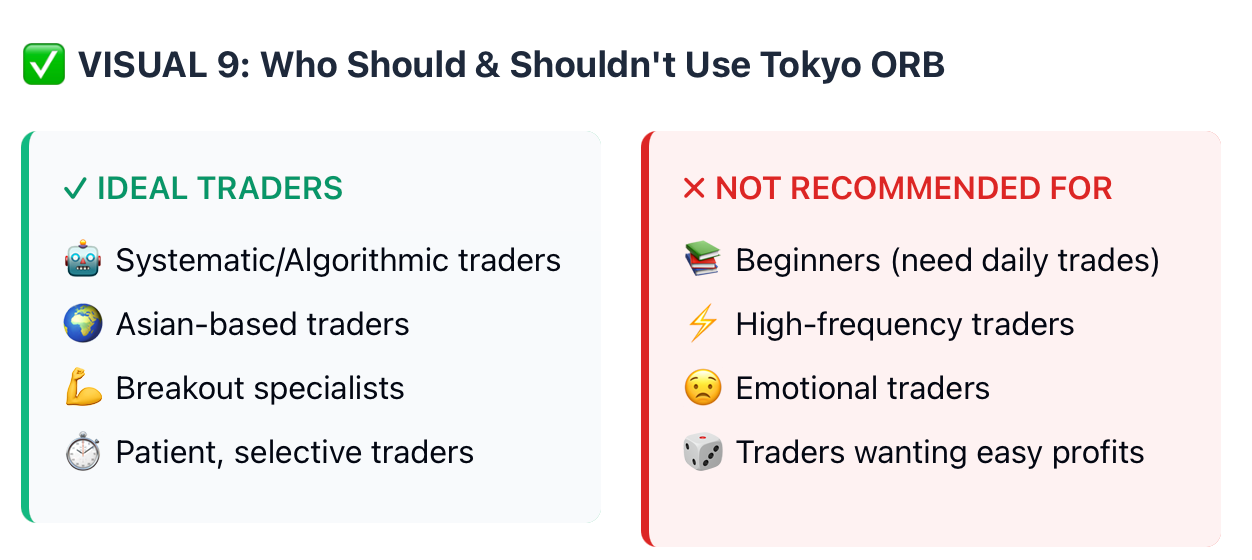
Asian-based traders can trade their local hours with the help of filtered Open Range Breakout (ORB) instead of trading on London or New York timeframes and trying to stay awake late into the night.
Breakout specialists who have a working knowledge of momentum dynamics can identify higher-quality setups and eliminate low volatility (aka ranges).
If you are a beginner looking for a consistent daily trading opportunity, you will likely become frustrated with the many "skip this session" days that occur frequently with Tokyo ORB. The patience required for trading the Tokyo ORB is significant.
High-frequency traders require more opportunities than can be provided by selective ORB trading during Tokyo's market hours.
You can certainly trade the Tokyo ORB effectively with the appropriate selection of volatility and trend conditions. Use appropriate filters to exclude low-quality days, and maintain realistic expectations of the number of opportunities. It isn't a money-printing system, but it's not a 'myth' either!
Ready to backtest your own ORB variations with real Tokyo session data? BTCdana.com provides institutional-grade historical tick data and advanced backtesting tools to help you find edges other traders miss.