NSDQ TECHNICAL ANALYSIS SHORT TERM VIEW
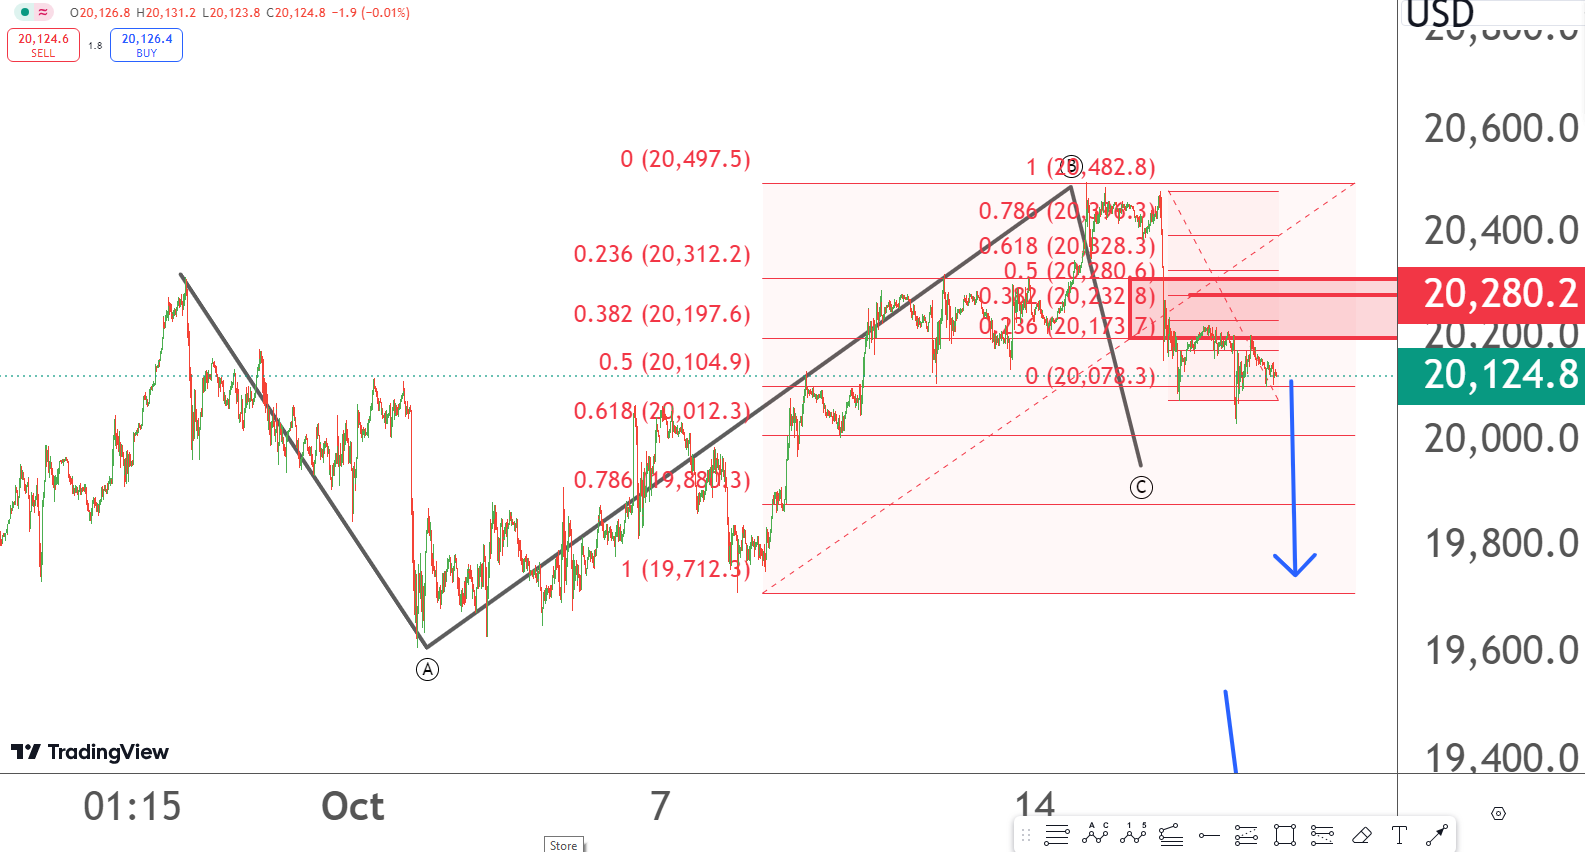
NSDQ running in negative trend and its immediate strong resistance are 19173 to 19233 level . Stop loss is 20300 level and it can fall towards 20016 level minimum because of irregular correction made on 5 minute chart .Intraday purpose selling is better for targets 20125,20100 and 20075 levels respectively with stop loss 20300 level. 5 minute chart showing irregular correction at level of 20060 so it can fall sharply below 20060 level .
QUICK FUNDAMENTAL LOOK
Wall Street's main indexes were on track for a muted open on Wednesday, following a selloff in tech and oil stocks in the previous session, as investors parsed quarterly results from banks including Morgan Stanley.
POC = Risk is a part of trading, use caution when placing orders and take market advice only into account .