NSDQ TECHNICAL ANALYSIS SHORT TERM VIEW
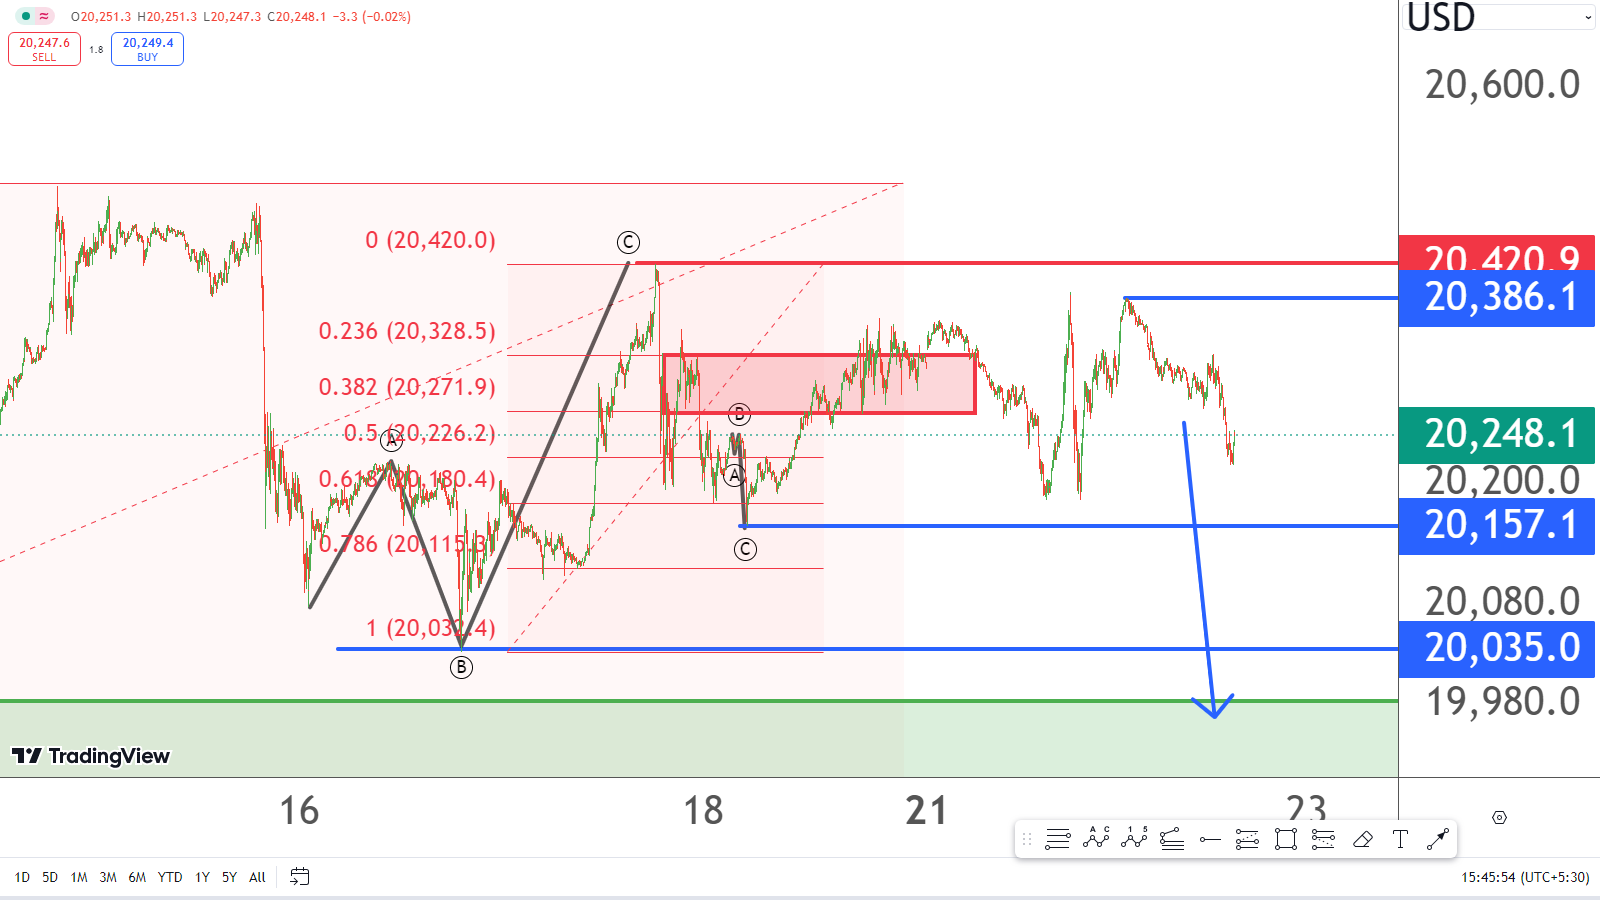
NSDQ running in negative trend and its immediate strong resistance are 19270 to 19328 level . Stop loss is 20500 level and it can fall towards 20016 level minimum because of irregular correction made on 15 minute chart .Intraday purpose selling is better for targets 20210,20180 and 20150 levels respectively with stop loss 20500 level. 5 minute chart showing irregular correction at level of 20157 so it can fall sharply below 20157 level .
QUICK FUNDAMENTAL LOOK
Wall Street futures dipped on Monday as investors braced for a busy week of major earnings reports that could either support or disrupt the market's ongoing rally.
POC = Risk is a part of trading, use caution when placing orders and take market advice only into account .