NSDQ TECHNICAL ANALYSIS SHORT TERM VIEW
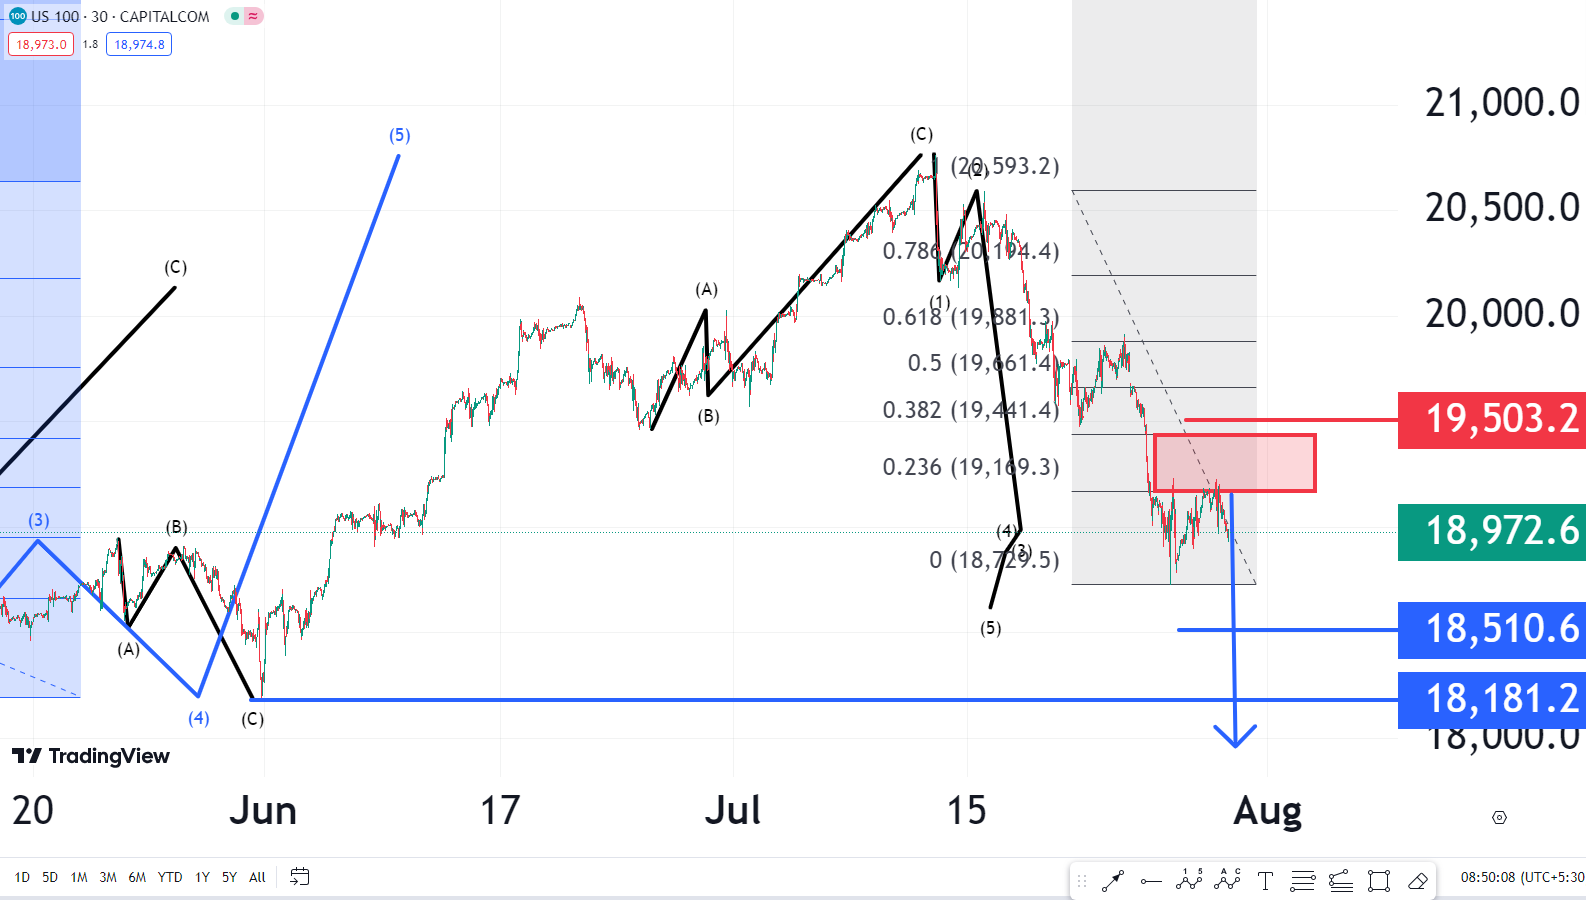
NSDQ running in negative trend and its immediate strong resistance are 19170 to19440 level . Stop loss is 19500 level and it can fall towards 18600 level positionally . Intraday purpose selling is better for targets 18940,18910 and 18870 levels respectively with stop loss 19500 level . 15 minute chart showing last wave 5 of c wave was extended so it can sharply fall towards 18500 level in very short term .
QUICK FUNDAMENTAL LOOK
The Nasdaq and S&P 500 edged higher on Monday in choppy trading as investors anxiously awaited a raft of technology company earnings, a Federal Reserve policy decision on interest-rate cuts and key US labor data, all this week.
POC = Risk is a part of trading, use caution when placing orders and take market advice only into account .