


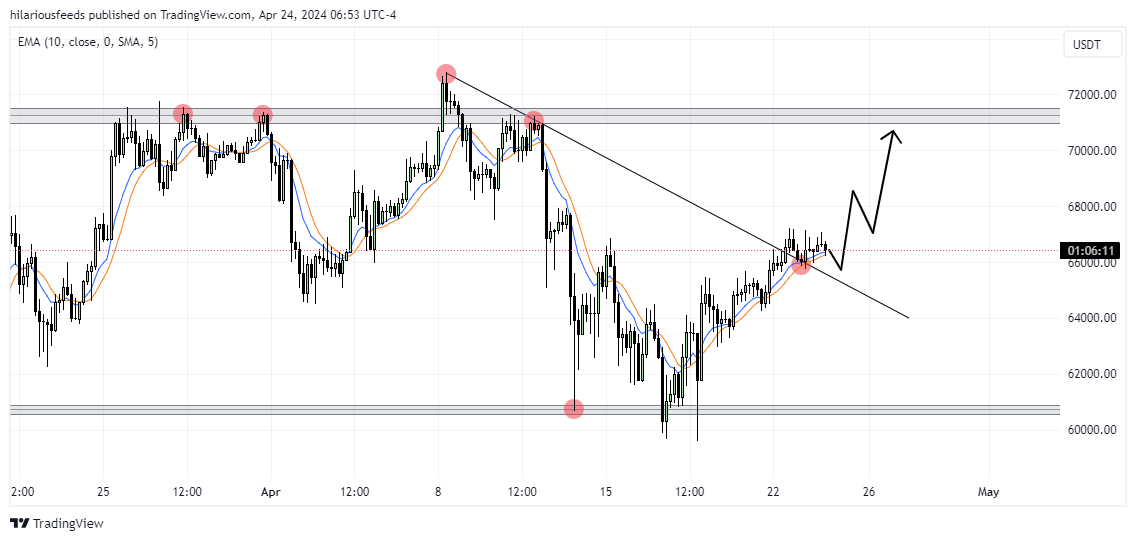
If we look at the chart, we can see how the price broke the 71000 resistance level, which coincided with the resistance zone, and started to trades inside consolidation. In range, the price in a short time declined to the 62600 support level, which coincided with the support zone, and even later made a fake breakout, after which turned around and made impulse up. Then BTC made a correction, after which rose to a resistance level and some time traded near, trying to break it, but failed and made a correction movement. After this, Bitcoin in a short time rose to the trend line, thereby exiting from consolidation, after which it turned around and started to decline. The price broke the 71000 resistance level again and made a retest, after which the price made impulse down to the support level. Soon, BTC broke this level and declined below, but a not long time ago it turned around and made a strong impulse up, breaking the 62600 level and recent trend line. Just now, Bitcoin continues to trades near the trend line and I expect that the price can continue to decline to a support level, breaking the trend line again. For this case, I set my target at the 62600 level.
📊QUICK FUNDAMENTAL LOOK
Crypto traders are anticipating a renewed weakness in the U.S. dollar, which would catalyze risk-taking and extend the rally in bitcoin {BTC}. However, some banks are forecasting continued dollar strength.
⚠️Warning: Trading contains elements of risk, please be careful when Making Orders, Market Recommendations are only for consideration.