


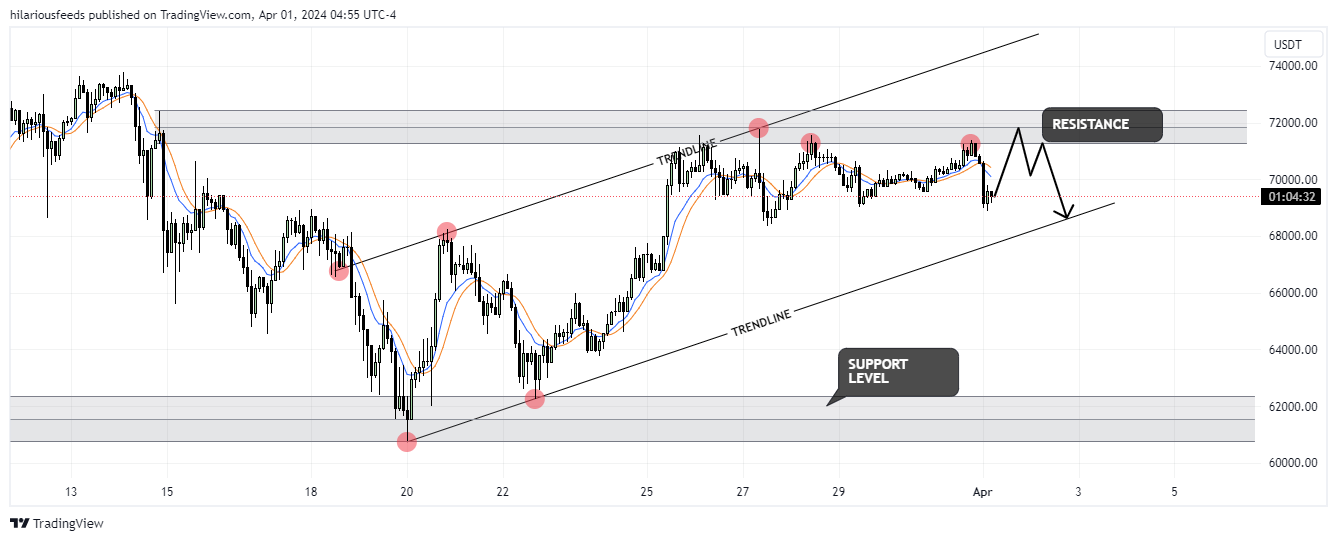
If we look at the chart we can see how the price some days ago declined to the support level, which coincided with the support zone and even soon fell lower, but later turned around and made impulse up to the 71800 resistance level, thereby making a fake breakout of 63100 level. Soon, BTC entered to resistance zone, but some time later it turned around and made a strong impulse down to the trend line, breaking resistance with support levels. After this movement, Bitcoin turned around and started to move up inside an upward channel, where in a short time broke the 63100 support level again and then rose to the resistance line of the channel. As well then, the price reached a resistance level one more time, but at once rebounded, and at the moment it trades below. For my mind, Bitcoin will reach a resistance level again, after which the price turn around and start to decline to support line of the upward channel, which is the trend line too. That's why I set my TP at 68000 points.
📊QUICK FUNDAMENTAL LOOK
The global digital assets market marked the end of 2024’s first quarter in a bullish mode. The cumulative crypto market cap which stood at around $1.66 trillion on January 1, 2024, stands at over $2.7 trillion on April 1, 2024. However, this major surge is backed by multiple positive developments linked to Bitcoin (BTC) over the past 3 months. Bitcoin eyes on new record
⚠️Warning: Trading contains elements of risk, please be careful when Making Orders, Market Recommendations are only for consideration.