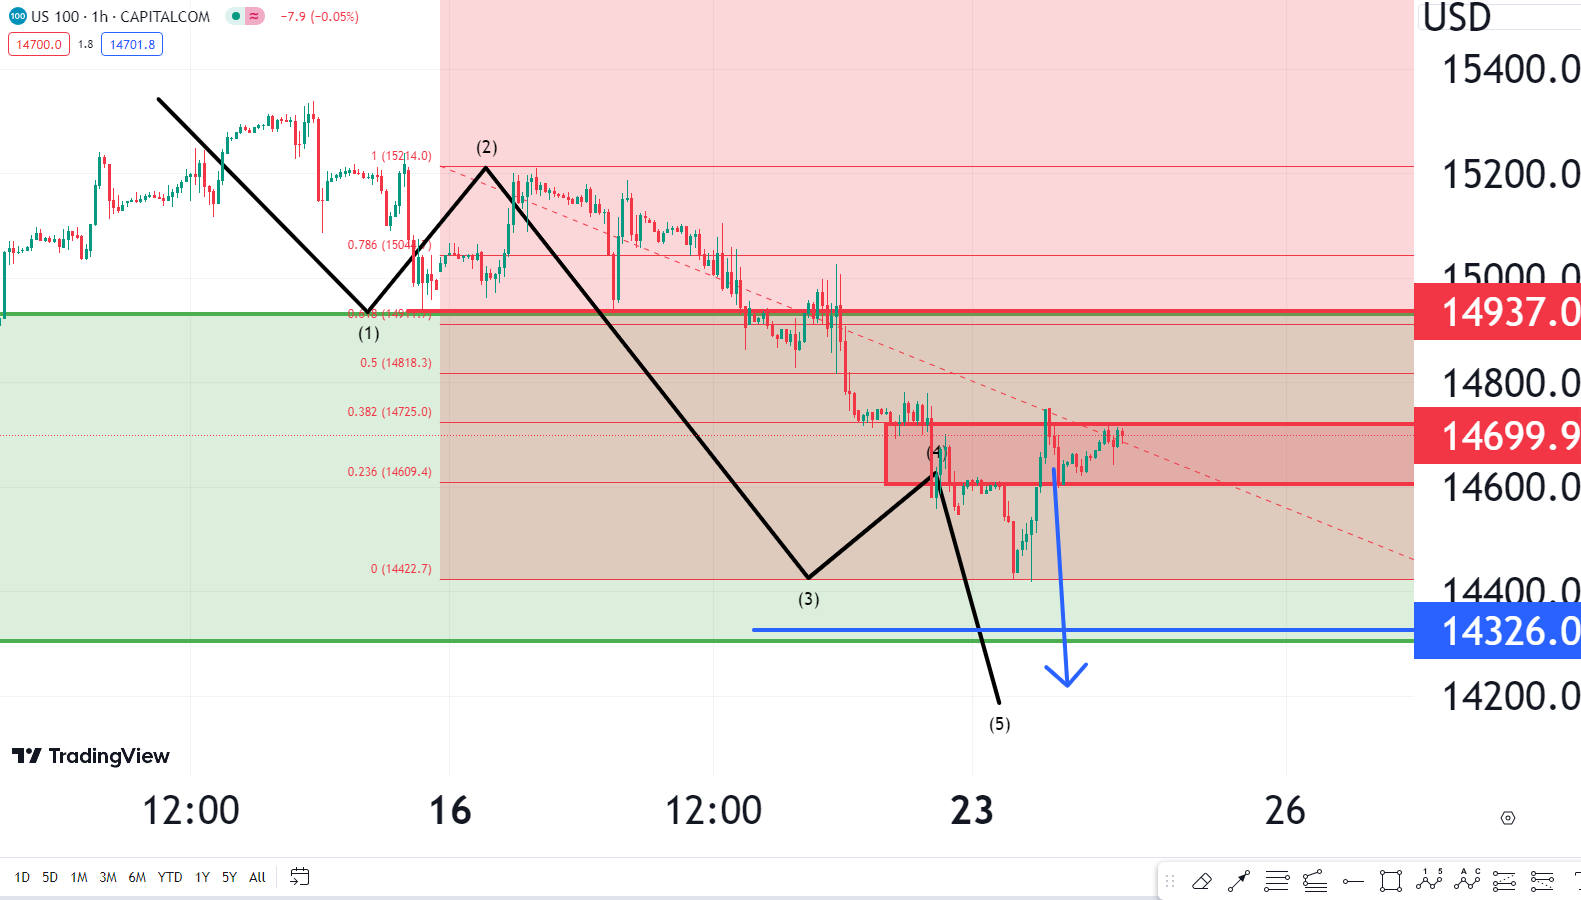
NSDQ TECHNICAL ANALYSIS SHORT TERM VIEW
NSDQ is running in downtrend and its trend is negative and its resistance area is 14611 to 14725 and overall final stop loss 14940.It can decline below 14400 level in form of wave 5 as shown in graph.Intraday purpose we can sell it at present levels with stop loss 14950 for 14630,14600 and 14550 targets respectively.
QUICK FUNDAMENTAL LOOK
Futures tracking Wall Street's main indexes gained on Tuesday after the benchmark U.S. Treasury yields slipped from the 5% milestone hit a day earlier, while investors looked forward to earnings from technology giants
POC = Risk is a part of trading, use caution when placing orders and take market advice only into account.


