NSDQ TECHNICAL ANALYSIS SHORT TERM VIEW
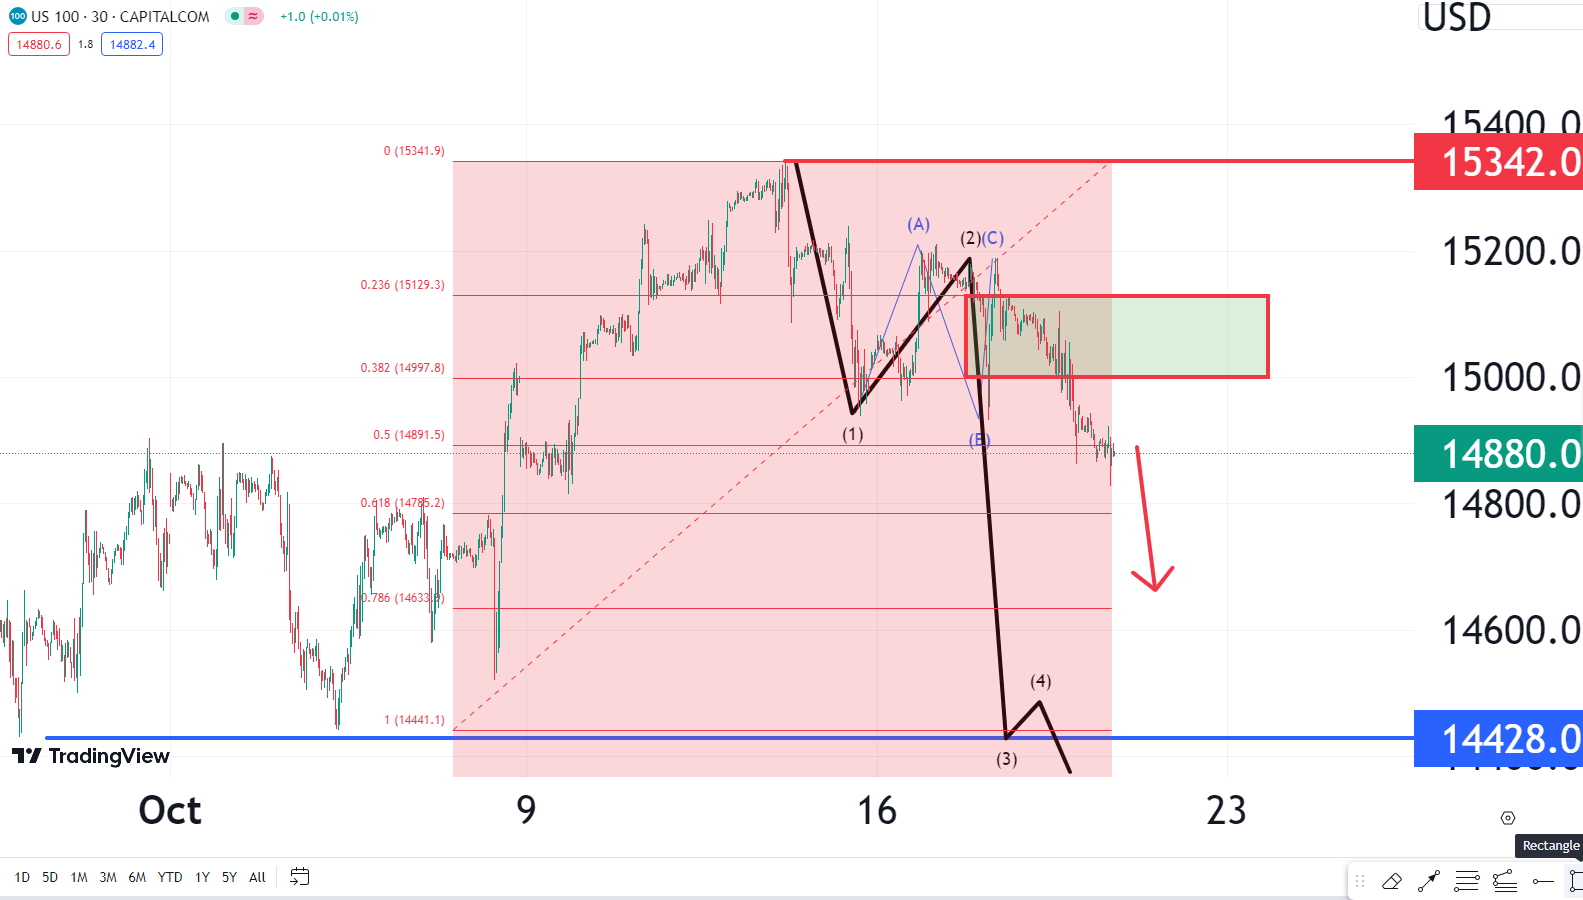
NSDQ has strong resistance 15000 to 15128 levels as red box marked in graph .At 15826 level irregular correction formed at 1 min chart so intraday it can sharply fall below 15826 anytime .Short term purpose 15150 stop loss we can use for selling towards downside main target 14425.Main stop loss is 15345 and calculations are showing target of 14425 level very soon.At level of 14425 there is corrective pattern made either abc simple zigzag or double zigzag pattern so it can fall sharply below 14425 level without touch 15345 level.
QUICK FUNDAMENTAL LOOK
US stock markets were shaken as stocks opened lower on Wednesday as the hospital blast in Gaza upped the Middle East tensions with oil prices jumping.
POC = Risk is a part of trading, use caution when placing orders and take market advice only into account.