


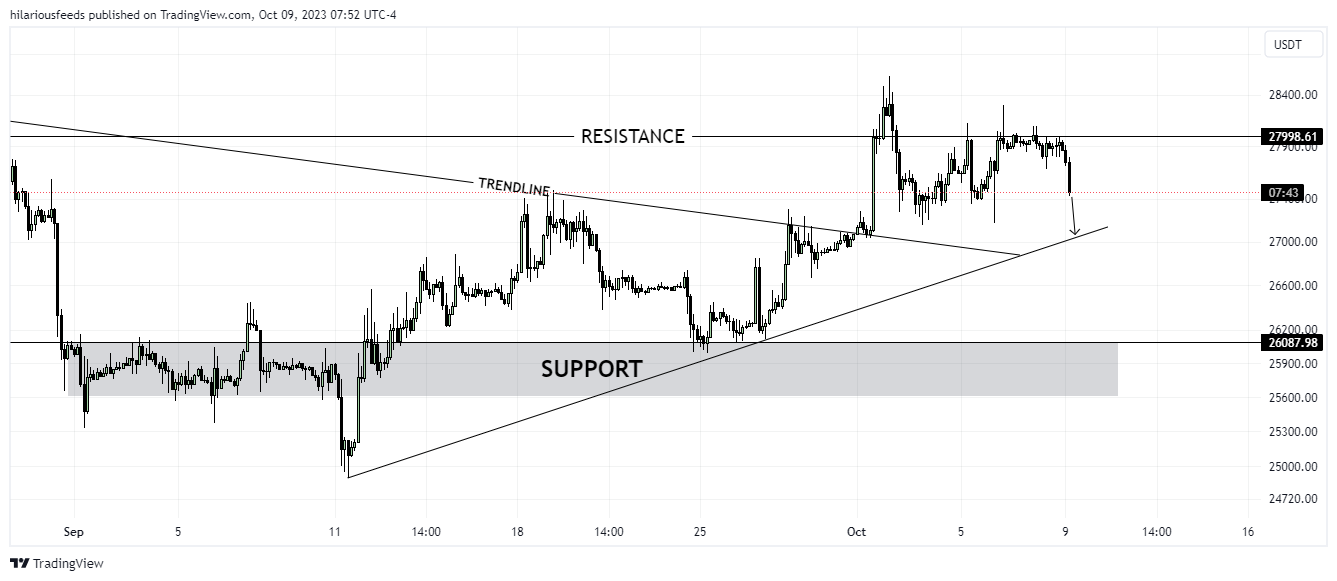
📊TECHNICAL ANALYSIS ON 3-HOUR TIMEFRAME
Some days ago price rebounded from the trend line and fell to the support line of the triangle, thereby breaking two support levels - 27750 and 26000. After this BTC bounced up and some time traded inside the support zone, but later it declined lower until to 24900 points, where at once rebounded and made a strong upward impulse to the trend line, breaking the 26000 support level. Then Bitcoin made a correction to this level, and when it declined price at once rebounded and continued to move up to the trend line again, but this time BTC broke this line, thereby exiting from the triangle and even rising higher support 2, but soon fell back to the trend line. As well recently price bounced from the trend line again, rose to the 27750 level, and broke it and at the moment BTC trades very close to this level. Now I expect that the price can break the support level, make a retest, and then continue to decline to the trend line. That's why I set up my target at the 27000 level, which coincides with this line.
📊QUICK FUNDAMENTAL LOOK
The BTC price increase gained momentum two weeks ago, forming a bullish engulfing candlestick pattern. This specific candlestick pattern erases all losses from the previous period, indicating a positive outlook for future price trends.
⚠️Trading contains elements of risk, please be careful when Making Orders, Market Recommendations are only for consideration.