


NSDQ TECHNICAL ANALYSIS SHORT TERM VIEW
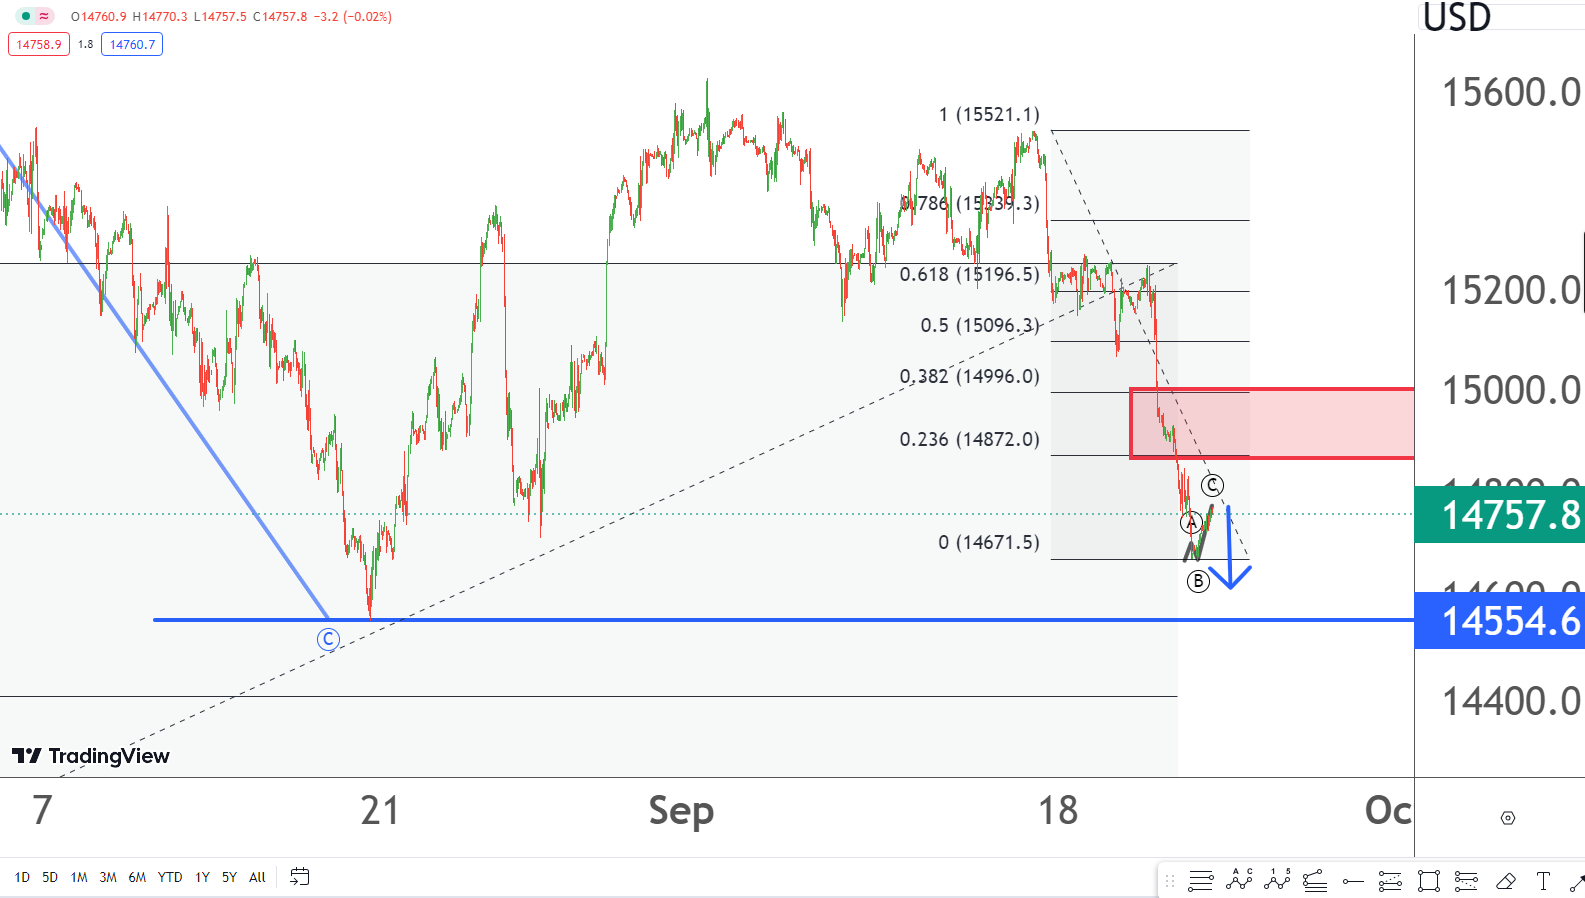 NSDQ has strong resistance 14872 to 15000 levels as red box marked in graph .From 14671 level irregular correction marked by abc is also formed which is giving signals to fall below this level .Selling can be done with stop loss 15030 expecting fall below 14671 level.Intraday purpose stop loss 15030 and targets are 14730,14710 and 14680 levels respectively.
QUICK FUNDAMENTAL LOOK
Real-economy stocks churned out a winning Thursday session.The tech-heavy Nasdaq couldn’t resist the selloff pressure and plunged 2% on the day for its worst single-day performance in four months.
POC = Risk is a part of trading, use caution when placing orders and take market advice only into account.