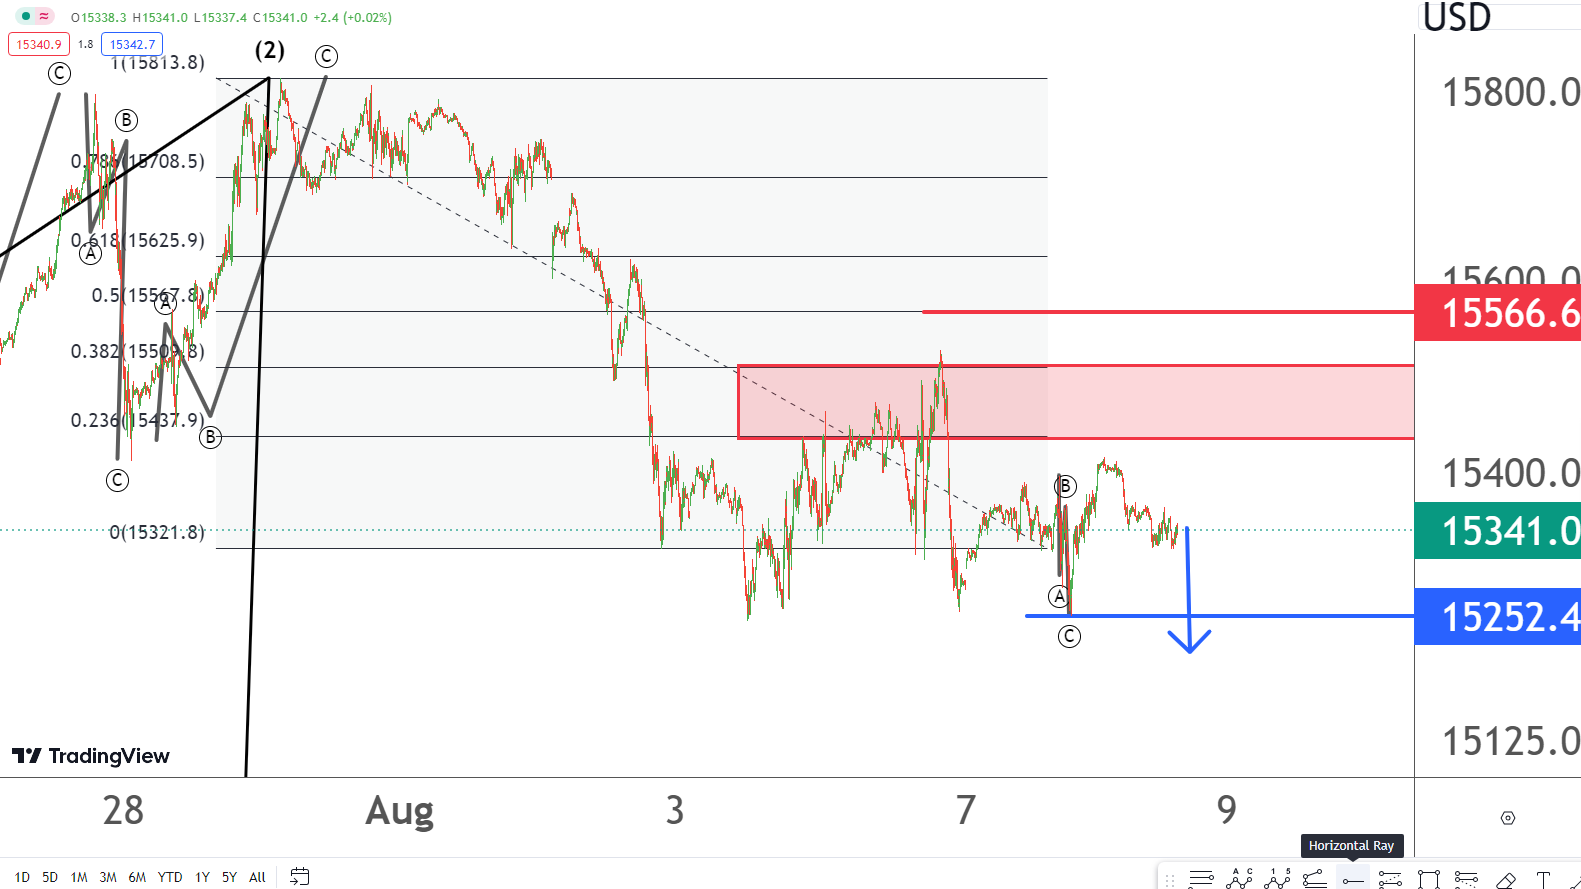
NSDQ TECHNICAL ANALYSIS SHORT TERM VIEW
NSDQ is running in negative trend . Wave 1 and wave 2 completed and wave 3 or wave c is going on presently and it is looking for 14917 target .Stop loss is 15570 and it can fall directly for 14917 target in form of wave c or wave 3 shown on graph. Immediate resistance are 15438 to 15510 levels marked by red box in graph.It has made irregular correction marked by abc pattern so it can fall below 15248 levels without touch 15570 level.After hitting 15250 level it can jump for 100 points or more so if good bounce come then again sell for downside target 15000 with stop loss 15570.
QUICK FUNDAMENTAL LOOK
Wall Street ends lower after US jobs report; Apple weighs.A partial counterweight to Apple for the S&P 500 and Nasdaq was Amazon.com.
POC = Risk is a part of trading, use caution when placing orders and take market advice only into account.


