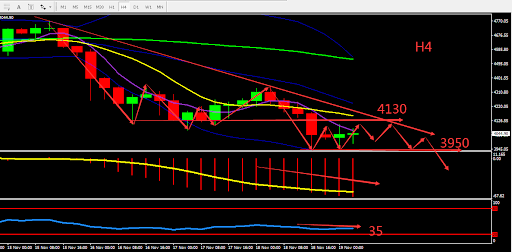
Ethereum plummeted on Thursday, breaking through the 4000 mark. The total amount of Ethereum stablecoin issued exceeded a record high of 90 billion U.S. dollars, the burned amount was 940,700 ETH, and the bridge TVL reached 24.26 billion U.S. dollars. Data: Most of the miners' income comes from block rewards, not transaction fees.
From a technical perspective, Ethereum daily graph closed bearish, the moving average form Death Cross at a high position and show a clear bearish signal. On H4 graph ETH shows the gradual formation of the ladder bottom pattern, BOLL is opening downward, and RSI indicator is around 35 which is a strong bearish signs. Overall, prioritise SELL. The chart below is showing the key point and the estimated trend, the deciding point is near 4000.

Resistance:4130-4180-4240
Support:4000-3950-3880
This material is from Quant Tech Limited and is being posted with permission from Quant Tech Limited. The views expressed in this material are solely those of the author and/or Quant Tech Limited and BTCDana is not endorsing or recommending any investment or trading discussed in the material. Before acting on this material, you should consider whether it is suitable for your circumstances and as necessary, seek professional advice


