Market Analysis of Gold on Monday 15 November 2021
On Monday's Asian session, gold was stable at around 1860. Last Friday, gold records its best weekly performance in six months, supported by a weaker US dollar and a sharp fall in US consumer confidence to its lowest level in 10 years. The strengthening of the stock market also puts pressure on gold.
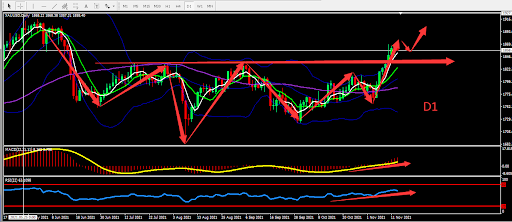
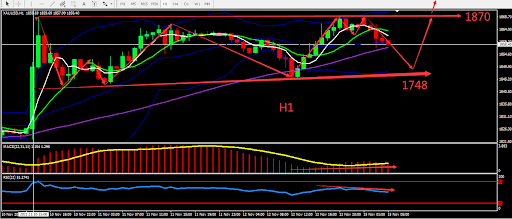
From a technical perspective, gold's daily graph forms a head and shoulder pattern. The daily candle broke the previous strong resistance and formed 7 bullish candles after briefly hitting the bottom. The indicators show bullish signal. On the 4-hour chart, the gold candle tried to break through a new high around 1870 but faced resistance and weakened. MA5 and MA10 converges and indicators are relatively bullish. Overall prioritize buying at low prices in the fluctuation zone. Consider the support and resistance zones, short term intraday trading split the bull bear point around 1848.


Resistance:1863-1870-1880
Support:1854-1848-1835
Market Analysis of Crude Oil on Monday 15 November 2021
On Monday Asia session, crude oil's price was at US$79.07 per barrel, falling nearly 1% last Friday. Investors can't predict whether the Biden administration will take action to curb oil prices. The White House press secretary stated that the US government has been urging oil-producing countries to increase crude oil production and seeking to ensure that gas stations are free from price fraud.
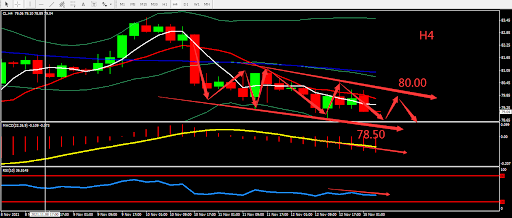
From a technical perspective, the weekly graph closed by 3 consecutive bearish candles. The daily graph shows that crude oil moved downward to around lower BOLL Band. On H4 graph, there was a downward channel. MACD volume increased while RSI weakened. Overall, prioritise Sell on high position. The chart below is showing the key point and the estimated trend, the deciding point whether to buy or sell is near 79.00.

Resistance:80.00-80.50-81.20
Support:78.50-77.60-76.50
This material is from Quant Tech Limited and is being posted with permission from Quant Tech Limited. The views expressed in this material are solely those of the author and/or Quant Tech Limited and BTCDana is not endorsing or recommending any investment or trading discussed in the material. Before acting on this material, you should consider whether it is suitable for your circumstances and as necessary, seek professional advice.


