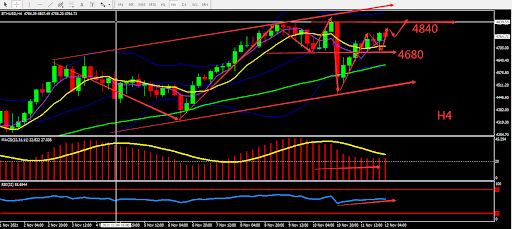
Ethereum bottomed out on Thursday and rebounded stronger than Bitcoin, currently at 4770. The total computing power of the Ethereum network is 782.19TH/s, with 68,120,906 coin-holding addresses. Since September, the number of active addresses has increased by about 48%, and the 24h chain transaction volume is 2,107,824 ETH.
From a technical perspective, Ethereum daily graph closed bullish, rebounding more than 60% from yesterday, and the indicators remained strong. H4 graph shows that the candle stable on middle BOLL band and there are signs of formation of head and shoulders pattern. MACD shrinks, and RSI maintains a slow upward trend. Overall, prioritise BUY within the fluctuation zone. The chart below is showing the key point and the estimated trend, the deciding point is near 4680.

Resistance:4840-4870-5000
Support:4680-4600-4460
This material is from Quant Tech Limited and is being posted with permission from Quant Tech Limited. The views expressed in this material are solely those of the author and/or Quant Tech Limited and BTCDana is not endorsing or recommending any investment or trading discussed in the material. Before acting on this material, you should consider whether it is suitable for your circumstances and as necessary, seek professional advice


