On Monday, Bitcoin fell below $60,000. The difficulty of Bitcoin has been raised to 21.66T, which has been raised for eight consecutive times since July 31. Bitcoin ETF pushed CME Group's BTC open feature contract and trading volume to record highs. The blockchain settlement platform can shorten inter-bank transactions from two days to two minutes.
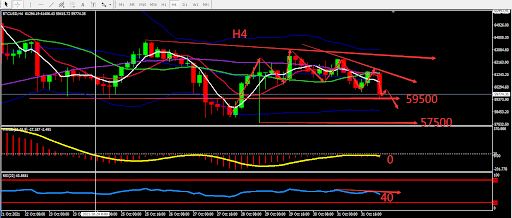
From a technical perspective, the weekly graph closed by doji star. The daily graph fluctuated within a small interval. On H4 graph, bitcoin formed head and shoulder pattern. MA converges and moves downward. RSI also turned downward. Overall, prioritise Sell at high position. The chart below is showing the key point and the estimated trend, the deciding point whether to buy or sell is near 59500.

Resistance:60700-61500-62400
Support:59500-58600-57500
This material is from Quant Tech Limited and is being posted with permission from Quant Tech Limited. The views expressed in this material are solely those of the author and/or Quant Tech Limited and BTCDana is not endorsing or recommending any investment or trading discussed in the material. Before acting on this material, you should consider whether it is suitable for your circumstances and as necessary, seek professional advice.


