Market Analysis of Gold on Thursday 28 October 2021
Gold prices rose on Wednesday and continued to strengthen to around US$1,800 per ounce on Thursday. This was due to a surge in US trade, weak US dollar yields and US Treasuries. The yield on the 10-year US Treasury bond weakened to 1.547% which supported the strengthening of the value of the precious metal as a hedging tool for investors. After the Bank of Canada's rate decision was released, gold prices fell more than $10 to hit a low of $1,783.51, supporting gold prices ahead of major central bank policy meetings.
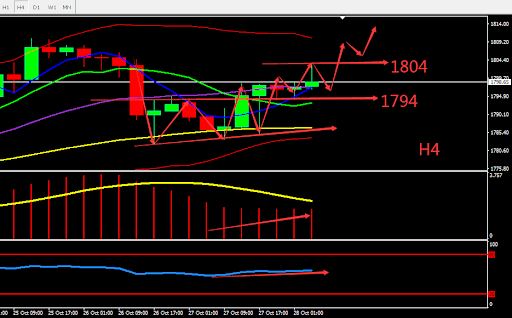
From a technical perspective, gold's daily candle reaches the support from MA10, rebounded then closed bullish. The ladder top pattern is perfectly formed, MACD continues to be above the 0 axis and strengthens. On the 4-hour chart, the lower BOLL band and MA60 is the main support in the short term. The overall indicator is relatively strong. Overall prioritize buying at low prices in the fluctuation zone. Consider the support zone and resistance zone, short term intraday trading split the bull bear point around 1794.

Resistance:1795-1800-1814
Support :1782-1776-1765
Market Analysis of Crude Oil on Thursday 28 October 2021
Crude oil fell 2.31 US dollars on Wednesday, or 2.7%, and settled at US$81.59 per barrel. The U.S. EIA inventory report shows that as of the week of October 22, crude oil inventories increased by 4.268 million barrels, far exceeding the expected 2 million barrels, prompting the market to sell long positions. The increasing possibility of Iranian crude oil returning to the market further contributing to the decline in oil prices. However, the inventory of refined oil products fell last week, and the tank inventory in the largest oil storage center in the United States decreased. Pay attention to the risk of strengthening after weakening.
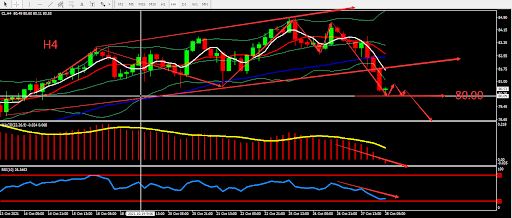
From a technical perspective, the daily graph closed by bearish candle without shadow. MA5 and MA10 converged. Focus on the support at around 80. H4 graph shows that BOLL widened downwards. Short-term MA weakened. Overall, prioritise Sell. The chart below is showing the key point and the estimated trend, the deciding point whether to buy or sell is near 80.00.

Resistance:81.20-81.80-82.60
Support:80.00-79.00-78.10
This material is from Quant Tech Limited and is being posted with permission from Quant Tech Limited. The views expressed in this material are solely those of the author and/or Quant Tech Limited and BTCDana is not endorsing or recommending any investment or trading discussed in the material. Before acting on this material, you should consider whether it is suitable for your circumstances and as necessary, seek professional advice.


