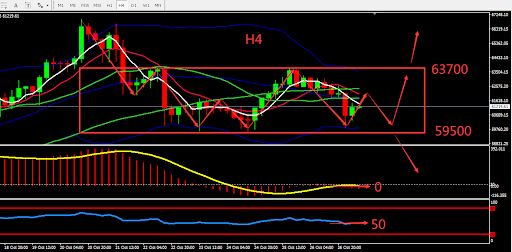
On Wednesday, Bitcoin continued its downward trend on Tuesday, breaking through $60,000, and currently fluctuates at $61,200. USDT accounts for about 55.95% of Bitcoin transactions. The electricity cost of a single BTC transaction exceeds $100. Direxion applied to launch a short Bitcoin futures ETF. The Bank of Spain opens registration applications for crypto service providers.
From a technical perspective, the daily graph closed by doji star. Bitcoin maintained bullish trend and fluctuated within the interval. Indicator was relatively bullish. On H4 graph, bitcoin fluctuated within the interval of 63700-59500. BOLL narrowed; MA converges. MACD moved around the 0 axis, and RSI was at level 50. Overall, there is a risk of market change. Prioritise operation within the fluctuation zone. The chart below is showing the key point and the estimated trend, the deciding point whether to buy or sell is near 59500.

Resistance:62500-63700-65000
Support:60400-59500-58000
This material is from Quant Tech Limited and is being posted with permission from Quant Tech Limited. The views expressed in this material are solely those of the author and/or Quant Tech Limited and BTCDana is not endorsing or recommending any investment or trading discussed in the material. Before acting on this material, you should consider whether it is suitable for your circumstances and as necessary, seek professional advice.


