Market Analysis of Gold on Wednesday 27 October 2021
On Wednesday in the Asian session, gold fell below 1790 US dollars per ounce in the short term. Gold prices continued their downward trend on Tuesday, and the US dollar index remained steady at levels near 93.90. A strengthening US dollar and strong corporate earnings have boosted investor demand for higher risk assets. The consumer confidence index rose to 113.8 from 109.8 in September, exceeding economists' expectations who had previously forecast the data to be around 108.4.
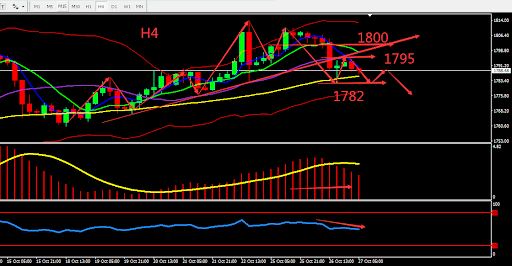
From a technical perspective, the daily gold graph closed bearish for the first time after a consecutive bullish close, the Gold candle touched the upper BOLL band and fell. The short-term trend remains unchanged, and the RSI is near 50. On the 4 hours chart, the uptrend line was broken. 1795-1800 becomes a short-term resistance level. MA forms Death Cross and there is still room for further drop. Overall prioritize selling at high prices in the fluctuation zone. Consider the support zone and resistance zone, short term intraday trading split the bull bear point around 1800.

Resistance:1795-1800-1814
Support:1782-1776-1765
Analysis of Crude Oil on Wednesday 27 October 2021
Oil prices rose slightly to the highest level since 2014 on Tuesday, supported by global supply shortages and strong demand from the United States, the world's largest consumer. US API crude oil inventories released this morning show an increase of 2.3 million barrels, gasoline inventories increased by 500,000 barrels, and distillate inventories increased by 1 million barrels, depressing crude oil prices. European benchmark natural gas prices have repeatedly hit record highs in recent weeks, pipeline transportation has been restricted, and they must compete with Asia for natural gas. If extreme cold weather is encountered this year, oil prices may continue to rise.
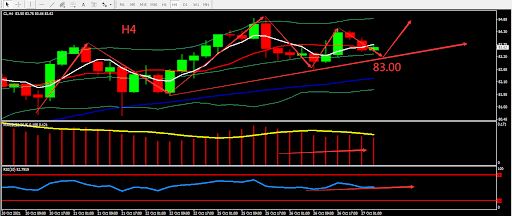
From a technical perspective, the daily graph maintained its bullish trend. MA showed that the trend will continue to strengthen. On H4 graph, crude oil fell back but BOLL and MA maintained bullish trend. MACD maintained its volume. Overall, prioritise operation within the fluctuation zone. The chart below is showing the key point and the estimated trend, the deciding point whether to buy or sell is near 83.00.

Resistance:84.40-85.00-86.00
Support:83.00-82.30-81.50
This material is from Quant Tech Limited and is being posted with permission from Quant Tech Limited. The views expressed in this material are solely those of the author and/or Quant Tech Limited and BTCDana is not endorsing or recommending any investment or trading discussed in the material. Before acting on this material, you should consider whether it is suitable for your circumstances and as necessary, seek professional advice.


