Market Analysis of Gold on Tuesday 26 October 2021
On Monday, gold prices stabilized at 1800 levels, as a weak dollar boosted gold prices. The increase in the inflation rate in the last two months exceeded expectations, but economic growth is still disappointing. Slow growth, rising cost, and the risk of stagflation begins to emerge. Severe stagflation can have a very bad impact on the economy and financial markets. Assets will also be depressed, and the value of gold as a store of value is more stable.
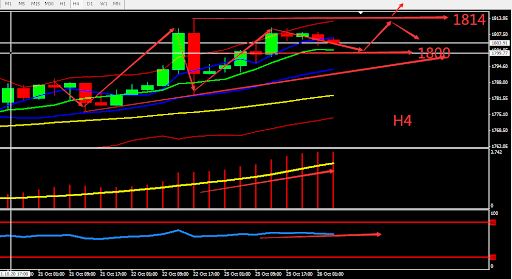
From a technical perspective, gold's daily graph closed bullish for 5 days in a row, completing its uptrend line. The MA line crosses at the bottom and forms the Golden Cross. On the 4-hour chart, the gold candle forms a ladder top pattern, the BOLL is widening and shows no sign of weakness. The MA line is diverging and the MACD is strengthening. Overall prioritize buying at low prices in the fluctuation zone. Consider the support zone and resistance zone, short term intraday trading split the bull bear point around 1800.

Resistance:1808-1814-1820
Support:1800-1792-1783
Market Analysisof Crude Oil on Tuesday 26 October 2021
On Monday, crude oil stopped its increase after hitting around US$85 per barrel for the first time since 2014, as the economy in the United States and other parts of the world rebounded to pre-epidemic levels as demand, insufficient investment is leading to supply shortages, and consumption rebound, and supply tensions are likely will push up oil prices further. What deserves attention is the upcoming negotiations between Iran and the European Union, which may lead to the resumption of the 2015 nuclear agreement.
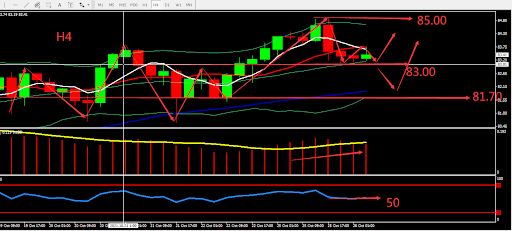
From a technical perspective, the daily graph shows that crude oil rose to level 85, fell back, and closed by gravestone pattern. MACD maintained a bullish trend. RSI maintained the bullish trend above level 70. On H4 graph, crude oil was stable and supported by middle BOLL band. There was a sign of narrowing and the BOLL point upwards. RSI weakened and is neutral. Overall, prioritise operation within the fluctuation zone. The chart below is showing the key point and the estimated trend, the deciding point whether to buy or sell is near 83.00.

Resistance:83.80-84.60-85.00
Support:83.00-82.30-81.70
This material is from Quant Tech Limited and is being posted with permission from Quant Tech Limited. The views expressed in this material are solely those of the author and/or Quant Tech Limited and BTCDana is not endorsing or recommending any investment or trading discussed in the material. Before acting on this material, you should consider whether it is suitable for your circumstances and as necessary, seek professional advice.


