Ethereum remained volatile on Monday and is currently quoted at $4130. The total computing power of the Ethereum network is 719.87TH/s, and the current holding addresses are 65,899,730, an increase of 140,844 compared to the same period last year. The number of active addresses reached a 4-month high. The transaction volume on the 24h chain was 1,092,357 ETH and the burn volume was 614,500 ETH. The amount of burning decreased by 22.27% month-on-month. The total locked up volume is 99.66 billion U.S. dollars, the net locked up volume is 75.3 billion U.S. dollars, and the number of addresses holding more than 0.1 ETH setting a new record.
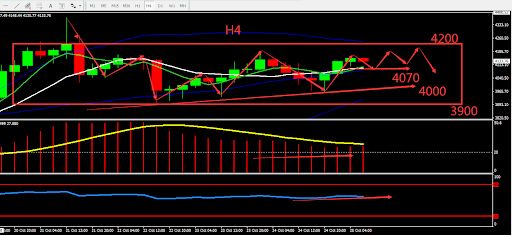
From the technical perspective, Ethereum’s weekly graph closed with four consecutive closed bullish candles, reaching the top position. The indicators are showing signs of correction. H4 graph shows that Ethereum entered a rectangle consolidation zone. BOLL and the moving average flattened. Overall, Ethereum is likely to continue to fluctuate. The chart below is showing the key point and the estimated trend the deciding point whether to buy or sell is near 4000.

Resistance:4200-4270-4370
Support:4070-4000-3900
This material is from Quant Tech Limited and is being posted with permission from Quant Tech Limited. The views expressed in this material are solely those of the author and/or Quant Tech Limited and BTCDana is not endorsing or recommending any investment or trading discussed in the material. Before acting on this material, you should consider whether it is suitable for your circumstances and as necessary, seek professional advice


