


Market Analysis of Gold on Monday 25 October 2021
On Monday Asian session, Gold was trading at around 1797. Last Friday, gold prices skyrocketed and then declined. Prior to this, Fed Chair Powell said that he expects inflation to ease next year, and the Fed will begin to scale back its stimulus plan. However, a weak dollar and US bond yields still support gold prices. After the market digested the Fed's expectations to reduce bond purchases in November, the rise in gold prices this week was driven by inflation expectations.
From a technical perspective, although the weekly candle continued to close bullish, it is still below 1800. The gold candle is still trying to break out of the fluctuation zone at the bottom. The daily gold candle forms a Ladder Top pattern, and the indicators are strengthening. The 4-hour chart shows strengthening, MA divergence and MACD volume strengthen. Overall prioritize buying at low prices in the fluctuation zone. Consider the support and resistance zones, short term intraday trading split the bull bear point around 1800.
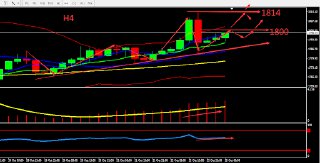
Resistance:1800-1808-1814
Support:1790-1783-1776
Market Analysis of Crude Oil on Monday 25 October 2021
On Monday Asia session, crude oil continued its upward trend, hitting a seven-year high in early trading to US$84.37 per barrel. As the market fears that crude oil consumption is growing faster than supply, shortages of natural gas and coal are triggering additional demand for petroleum products. And because the OPEC+ oil-producing countries alliance only moderately supplies the market, the decline in US inventories has helped oil prices approach the level 85.
From a technical perspective, the weekly graph closed by 7 consecutive bullish candles and broke a new high. The weekly graph relied on MA to move upwards. The price of crude oil on the daily graph was above MA5 and continue to fluctuate upwards. MACD strengthened. H4 graph shows that the opening of BOLL widened, and crude oil continue to fluctuate upwards. RSI was around level 65. Overall, prioritise Buy. The chart below is showing the key point and the estimated trend, the deciding point whether to buy or sell is near 83.70.
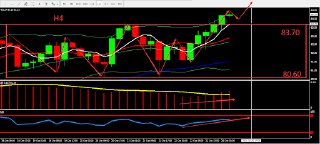
Resistance:84.60-85.20-86.00
Support:83.70-82.60-81.60
This material is from Quant Tech Limited and is being posted with permission from Quant Tech Limited. The views expressed in this material are solely those of the author and/or Quant Tech Limited and BTCDana is not endorsing or recommending any investment or trading discussed in the material. Before acting on this material, you should consider whether it is suitable for your circumstances and as necessary, seek professional advice.