


Bitcoin rose strongly on Wednesday, breaking a new all-time high and hitting $66,944, currently at $64,700. The total market value of cryptocurrencies exceeded 2.7 trillion U.S. dollars, with a 5 day increase of $100 billion. Bitcoin’s open positions exceeded $25.8 billion, accounting for nearly 50% of the entire network. Bitcoin fund inflows increased again. JP Morgan Chase: Bitcoin is a better inflation hedge tool than gold.
From a technical perspective, the weekly graph show that Bitcoin broke a new all-time-high record. The daily graph shows that Bitcoin closed with 3 consecutive bullish candles. Short-, medium-, and long-term MA strengthened. The indicators showed bullish sign. On H4 graph, bitcoin formed upper ladder. Bitcoin’s graph show a healthy increase. The indicators maintain its bullish signal. Overall, prioritise Buy. The chart below is showing the key point and the estimated trend, the deciding point whether to buy or sell is near 67000.
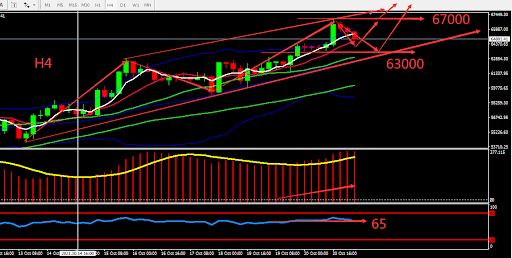
Resistance:65000-66000-68000
Support:63000-61500-60000
This material is from Quant Tech Limited and is being posted with permission from Quant Tech Limited. The views expressed in this material are solely those of the author and/or Quant Tech Limited and BTCDana is not endorsing or recommending any investment or trading discussed in the material. Before acting on this material, you should consider whether it is suitable for your circumstances and as necessary, seek professional advice.