Market Analysis of Gold on Thursday 21 October 2021
On Thursday in the Asian session, Gold continued to strengthen due to a weaker US dollar and inflation concerns. However, the better-than-expected performance of US companies and Bitcoin hitting record highs limited gold's price gains. With the increase in cases of the COVID-19 virus, labour shortages and supply chain problems, commodity prices continue to rise and trigger higher prices for consumer goods. The inflation crisis intensified, which supported gold prices. The focus of the day will be data on initial unemployment claims and data on US home sales.
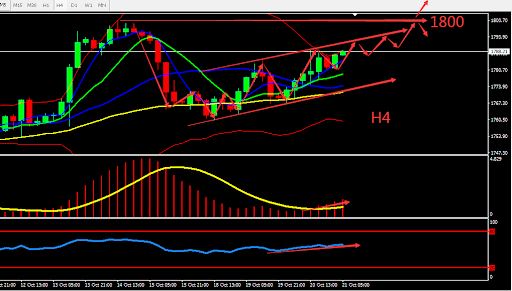
From a technical perspective, gold's daily candle continues to close bullish, forming a head and shoulders pattern at the bottom. If gold manages to stabilize at 1780, then this is a positive signal for bulls. The 4 hours chart shows signs of stabilization, if gold continues to operate within the pressure of the BOLL's upper band, then gold will test 1800. If the upward momentum slows down, then gold will re-enter the fluctuation zone. Overall prioritize buying at low prices in the fluctuation zone. Consider the support zone and resistance zone, short term intraday trading split the bull bear point around 1781.

Resistance:1794-1700-1807
Support:1781-1772-1760
Market Analysis of Crude Oil on Thursday 21 October 2021
Crude oil continued to strengthen on Wednesday, hitting a new short-term high of $83.48 per barrel, the highest level since 2017. The EIA inventory report released earlier showed that crude oil inventories dropped unexpectedly that week, with inventories in the largest crude oil storage area in the United States reaching its lowest level in three years, and gasoline supply hitting a two-year low further tightening supply. Oil prices have risen at a time when coal and natural gas shortages have led to tight energy supplies. At the same time, economic recovery has also brought a rebound in oil demand.
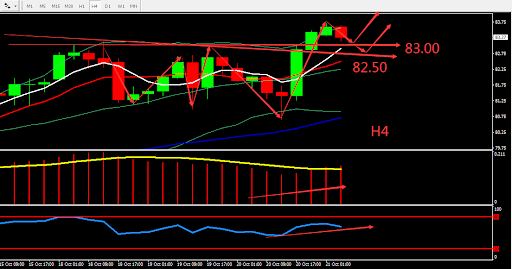
From technical perspective, the daily candle of crude oil continues to increase, and all indicators show bullish signs. H4 graph shows that crude oil broke through short-term high of 83.00 dan stabilize at short-term low. BOLL moved upwards while indicators show no signs of weakening. Overall prioritize Buy on low within the fluctuation zone. The chart below is showing the key point and the estimated trend, the deciding point whether to buy or sell is near 83.00.

Resistance:83.80-84.40-85.00
Support:83.00-82.50-81.30
This material is from Quant Tech Limited and is being posted with permission from Quant Tech Limited. The views expressed in this material are solely those of the author and/or Quant Tech Limited and BTCDana is not endorsing or recommending any investment or trading discussed in the material. Before acting on this material, you should consider whether it is suitable for your circumstances and as necessary, seek professional advice.


