Market Analysis of Gold on Wednesday 20 October 2021
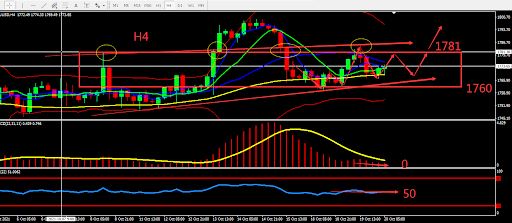
On Wednesday Asian session, Gold was trading at around 1773. On Tuesday, the price of gold rose slightly as the US dollar index weakened. The number of housing developments in the United States fell 1.6% to an annual rate of 1.56 million units. But US Treasury yields and the positive performance of American companies dragged down gold prices. The IMF stated that any untimely policy normalization or misunderstood policy communication could trigger massive capital outflows and rising borrowing costs in developing Asia.
From a technical perspective, the gold daily candle closed bullish with an upper shadow closing near the MA10. MACD volume is near the 0 axis and is starting to shrink. On the 4-hour chart, Gold is below the middle BOLL band, moving averages are converging and bearish. The RSI is close to 50. Overall, prioritize operations in the fluctuation zone. Consider the support zone and resistance zone, short term intraday trading split the bull bear point around 1781.

Resistance:1781-1787-1800
Support:1767-1760-1750
Market Analysis of Crude Oil on Wednesday 20 October 2021
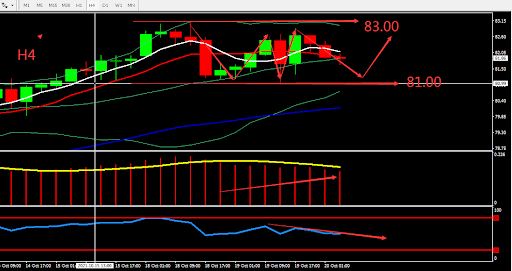
Crude oil rose by $0.91 on Tuesday or an increase of 1.06% at a price of $82.38/barrel. The global energy supply continues to be tight, and the temperature in Asia has dropped, renewing concerns about whether major crude oil consumer countries are able to meet heating needs when coals are in short supply. The energy crisis triggered by the shortage of natural gas and coal coincided with the rebound in demand in major economies after the epidemic. Crude oil prices have risen in the past eight weeks.
From a technical point of view, the daily candle of crude oil closed bullish, and continue to consolidate at high level above MA5. MACD strengthen above 0 axis, and the market sentiment is bullish. H4 graph shows that the weekly MA continue to converge and undergo correction above the middle BOLL band. RSI dropped to 50. Overall, prioritise Buy on Low within the fluctuation zone. The chart below is showing the key point and the estimated trend, the deciding point whether to buy or sell is near 81.00.

Resistance:82.60-83.20-84.00
Support:81.00-80.00-79.00
This material is from Quant Tech Limited and is being posted with permission from Quant Tech Limited. The views expressed in this material are solely those of the author and/or Quant Tech Limited and BTCDana is not endorsing or recommending any investment or trading discussed in the material. Before acting on this material, you should consider whether it is suitable for your circumstances and as necessary, seek professional advice.


