Market Analysis of Gold on Friday 15 October 2021
On Thursday, spot gold briefly hit above the $1,800 mark as the US dollar and US Treasury yields dropped. Data released by the United States showed that the number of initial unemployment claims last week fell sharply to the lowest level since mid-March 2020. The Producer Price Index (PPI) shows that final demand has increased, but the monthly and year-on-year growth rates are lower than expected. Although the US initial unemployment claims data released today is quite good, the US dollar index is still in a sluggish trend.
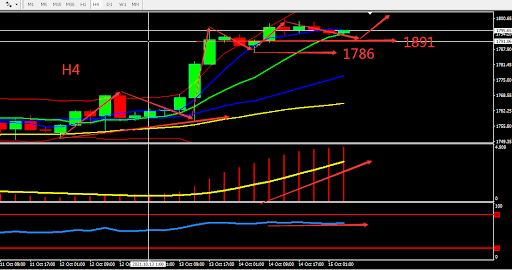
From a technical perspective, the daily gold line continued to rise and closed with a small bullish candle and the MA formed the Golden Cross on low position. Even though the MACD is below the 0 axis, MACD volume is shrinking. In the 4 hours chart the BOLL band continue to widen upwards, the RSI indicator strengthen above 65. Overall, prioritise buy on low in the fluctuation zone. Consider the support zone and resistance zone, short term intraday trading split the bull bear point around 1800.

Resistance:1800-1808-1823
Support:1791-1786-1780
Market Analysis of Crude Oil on Friday 15 October 2021
Oil prices rose slightly on Thursday and are currently quoted at US$81.20 per barrel. US crude oil inventories increased by 6.088 million barrels, the largest increase since the week of March 5, 2021, to 427 million barrels, and the market is expected to increase by only 702,000 barrels. The International Energy Agency (IEA) said that global energy shortages are expected to increase oil demand by 500,000 barrels per day and may increase inflation and slow the recovery of the global new covid pandemic. Rising natural gas prices and Saudi Arabia’s ignorance of calls to increase production have both pushed up oil prices.
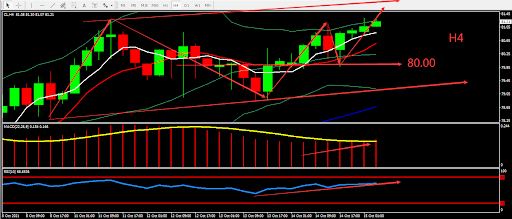
From a technical perspective, the daily graph closed bullish after fluctuated. The indicator showed bullish sign. On H4 graph, the upward trend has been completed. RSI rebounded after it fell. Indicator maintained the bullish signal. Overall, prioritise Buy. The chart below is showing the key point and the estimated trend, the deciding point whether to buy or sell is near 80.00.

Resistance:81.50-82.20-83.00
Support:80.80-80.00-78.80
This material is from Quant Tech Limited and is being posted with permission from Quant Tech Limited. The views expressed in this material are solely those of the author and/or Quant Tech Limited and BTCDana is not endorsing or recommending any investment or trading discussed in the material. Before acting on this material, you should consider whether it is suitable for your circumstances and as necessary, seek professional advice.


