Market Analysis of Gold on Thursday 14 October 2021
On Wednesday Gold rose nearly 2%, as the dollar and US Treasury yields fell, boosting demand for safe-haven assets like gold. The US Consumer Price Index (CPI) rose 0.4% after rising 0.3% in August and is expected to rise 0.3%. The annual inflation rate was 5.4%, which was the fifth consecutive month that there was an increase of more than 5% year-on-year, setting a record for the biggest annual increase since 2008. The probability that the Fed will raise interest rates in September next year has exceeded 90%.
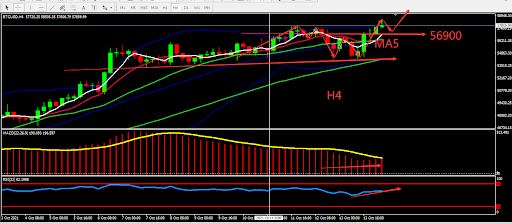
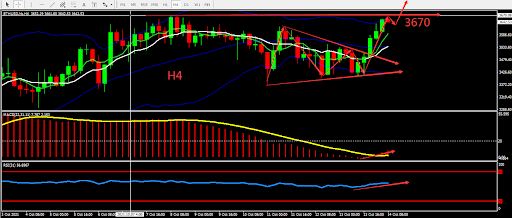
From a technical perspective, gold's daily graph closed bullish, stable at resistance levels 1770 and 1780, and faces resistance near the upper BOLL band. In the 4-hour chart, gold candle broke through the rectangle pattern. The BOLL is widening, MA formed golden cross at bottom position and MACD volume increases. Overall prioritize buying at low prices in the fluctuation zone. Consider the support zone and resistance zone, short term intraday trading split the bull bear point around 1780.

Resistance:1794-1800-1808
Support:1780-1770-1758
Market Analysis of Crude Oil on Thursday 14 October 2021
Crude oil first fell and then rose slightly due effect from fundamentals on Wednesday. API data showed that US crude oil inventories increased by 5.2 million barrels last week. Gasoline decreased by 4.6 million barrels and distillate oil decreased by 2.7 million barrels. OPEC lowered its forecast for global oil consumption in 2021 in its monthly market report. The organization said that although soaring natural gas prices may increase oil use in some areas such as power generation, it may also curb demand in other areas, including oil refining.
From a technical perspective, the daily graph closed by doji star, there was a hesitation in the short-term upward trend. Be alert to the risk of corrections on high position. On H4 graph, MACD was above the 0 axis but the volume decreased. MA converges. Overall, prioritise operation within the fluctuation zone, beware of correction. The chart below is showing the key point and the estimated trend, the deciding point whether to buy or sell is near 79.00.

Resistance:80.90-81.30-82.00
Support:79.70-79.00-78.00
This material is from Quant Tech Limited and is being posted with permission from Quant Tech Limited. The views expressed in this material are solely those of the author and/or Quant Tech Limited and BTCDana is not endorsing or recommending any investment or trading discussed in the material. Before acting on this material, you should consider whether it is suitable for your circumstances and as necessary, seek professional advice


