Market Analysis of Gold on Wednesday 13 October 2021
On Tuesday, US gold rose to $1770 and then fell back. As the Federal Reserve may announce a reduction in its debt-buying measure in November, the US index rose and hit a one-year high of 94.53. The IMF has lowered its forecast for global GDP growth in 2021, from 6.0% growth to 5.9%. The International Monetary Fund (IMF) is not so optimistic about the global economy in 2021, but still believes that there will be reasonable growth in the medium term.
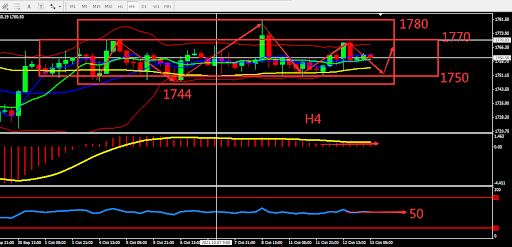
Technically, gold's daily graph closed with a small bullish candle, but hasn't exited the fluctuation zone around 1750-1770. The 4-hour chart shows that the candle is slightly bullish, and continues to fluctuate above the middle BOLL band, and the RSI is relatively neutral at 50. Today prioritize operations in the fluctuation zone. Consider the support zone and resistance zone, short term intraday trading split the bull bear point around 1770.

Resistance:1763-1767-1776
Support:1755-1750-1745
Market Analysis of Crude Oil on Wednesday 13 October 2021
Oil prices fluctuated on Tuesday, and the price remained at $80 which is the highest level in the past seven years. The market seems to recognize that rising energy prices may have an impact on the recovery of the global economy. Driven by energy shortages in Asia, Europe and the United States, electricity prices have soared to record highs in recent weeks. The shortage of natural gas and coal in the winter in the northern hemisphere has prompted some people in the power industry to switch to fuels such as diesel and fuel oil. The surge in natural gas prices has also prompted power plants to switch fuels from cleaner natural gas to oil.
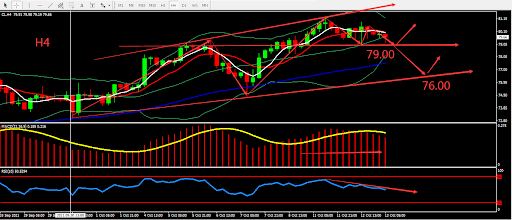
From technical perspective, after the daily graph closed by hammer pattern, it was closed again by Doji Star, showing a resistance. On H4 graph, there was a correction. BOLL narrowed, RSI reversed, MACD maintained bullish trend. Overall, prioritise operation within fluctuation zone. The chart below is showing the key point and the estimated trend, the deciding point whether to buy or sell is near 79.00.

Resistance:80.00-80.80-81.40
Support:79.00-78.00-76.00
This material is from Quant Tech Limited and is being posted with permission from Quant Tech Limited. The views expressed in this material are solely those of the author and/or Quant Tech Limited and BTCDana is not endorsing or recommending any investment or trading discussed in the material. Before acting on this material, you should consider whether it is suitable for your circumstances and as necessary, seek professional advice.


