Market Analysis of Gold on Tuesday 12 October 2021
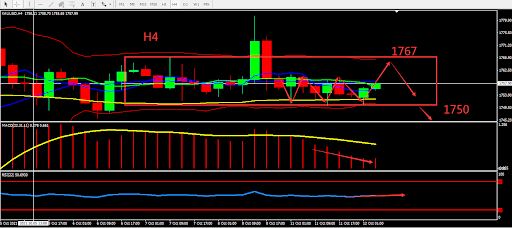
On Tuesday's Asian session, gold increased slightly and is currently trading around 1758. The US non-farm employment report (NFP) released on Friday brought a lot of shock to the markets. It will be difficult for the US Fed to delay the process of reducing debt purchases. As the Fed may scale back in November, there is a possibility that the US Treasury yields and the US dollar will strengthen, and gold will be under pressure. Concerns about high inflation and stagnant economic growth held back global stock market developments, giving gold some support.
From a technical perspective, gold's daily candle is under pressure below the middle BOLL band, reaching the top position and supressing market confidence. In the short term, the market will consolidate, therefore it will be difficult for gold to strengthen. On the 4-hour chart, the gold candle undergo correction due to its rapid strengthening and weakening. If the market starts to be active, then that means the market has determined its direction. The indicator is relatively neutral. Overall, prioritize operations within the fluctuation zone. Consider the support zone and resistance zone, short term intraday trading split the bull bear point around 1750.

Resistance:1763-1767-1776
Support:1750-1745-1737
Market Analysis of Crude Oil on Tuesday 12 October 2021
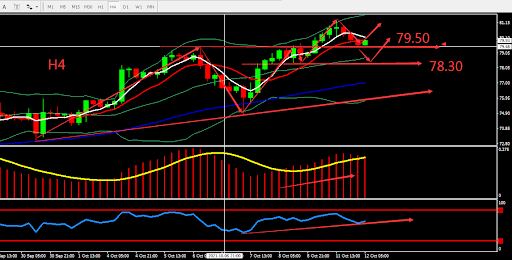
Crude oil fell in early trading on Tuesday and is currently fluctuating around $80. Global demand continues to recover, and natural gas prices increase to record price, which have stimulated more demand for petroleum products for power generation and heating. Oil prices have broken through $80 and remain strong. Although many countries have lingering concerns about the delta variant virus, the increase in vaccination rates and strong economic recovery have eased the lockdown in advanced economy. Global oil demand continues to grow and will reach pre-epidemic levels within a few months.
From a technical perspective, the daily graph closed by hammer pattern at level 80. The market bullish sentiment was strong. In short-term, it might be difficult for crude oil to drop its price. Indicators showed bullish signal. On H4 graph, crude oil broke through upper BOLL Band and formed 3 bearish candles. Short-term MA5 went downward, but mid and long-term MA still showed bullish sign. Any drop is an opportunity to enter the market. Overall, prioritise Buy. The chart below is showing the key point and the estimated trend, the deciding point whether to buy or sell is near 79.50.

Resistance:80.80-81.30-82.00
Support:79.50-79.00-78.30
This material is from Quant Tech Limited and is being posted with permission from Quant Tech Limited. The views expressed in this material are solely those of the author and/or Quant Tech Limited and BTCDana is not endorsing or recommending any investment or trading discussed in the material. Before acting on this material, you should consider whether it is suitable for your circumstances and as necessary, seek professional advice.


