Market Analysis of Gold on Friday 08 October 2021
On Thursday, Gold was down slightly, and the US dollar was steady at 94. Prior to the announcement of the non-farm employment (NFP) and unemployment rate, data on the number of initial unemployment claims in the United States fell 38,000 last week to 326,000, lower than the week's revised forecast of 362,000. US Treasury yields rose 4.7 basis points to 1.571%. Increase in US Treasury yields increase the cost of holding gold and fuel a bias that the Fed will soon reduce its economic support measures.
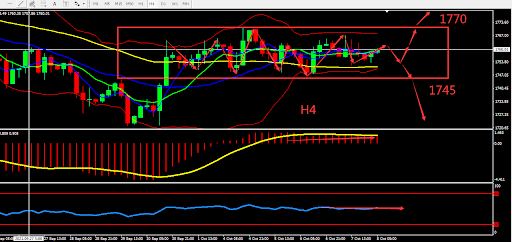
From a technical perspective, gold's daily candle is under resistance below the middle BOLL band and continues to close with small bullish and bearish candles. This suggests that the market has no direction and is waiting for the guidance from non-farm data (NFP). The 4 hours chart shows that gold is sideways around 1745-1770, the fluctuation interval is very small, and indicators are passive and neutral. Overall prioritize operations in the fluctuation zone and may open positions in case of a breakout. Consider the support zone and resistance zone, short term intraday trading split the bull bear point around 1748

Resistance:1765-1770-1778
Support:1753-1745-1735
Market Analysis of Crude Oil on Friday 08 October 2021
On Friday Asia session, Crude oil fluctuated around 79.10. Oil prices rose sharply on Thursday, as the US Department of Energy stated that "at this time" there is no plan to release strategic oil reserves to curb the rise in gasoline prices. At the same time, progress has been made in the US debt ceiling negotiations, and market risk appetite has increased, which has boosted oil prices. The market focus now returns to the shortage of global natural gas supply, which is bound to increase the demand for crude oil for power generation this winter and further stimulate oil prices.
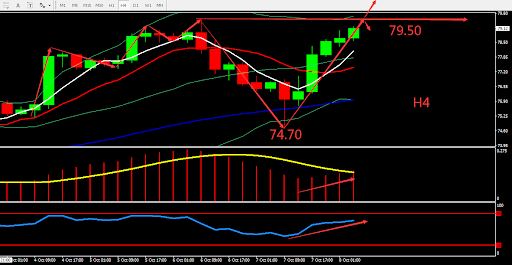
From a technical perspective, the daily graph closed bullish. MA continued to diverge. MACD volume strengthened. On H4 graph, crude oil formed V pattern reversal. Crude oil was stable on lower BOLL band and followed by a sharp increase, and is currently around the upper BOLL Band. Indicator was bullish. Overall, prioritise Buy. The chart below is showing the key point and the estimated trend, the deciding point whether to buy or sell is near 79.50.

Resistance:79.50-80.00-81.00
Support:78.50-78.00-77.20
This material is from Quant Tech Limited and is being posted with permission from Quant Tech Limited. The views expressed in this material are solely those of the author and/or Quant Tech Limited and BTCDana is not endorsing or recommending any investment or trading discussed in the material. Before acting on this material, you should consider whether it is suitable for your circumstances and as necessary, seek professional advice.


