Market Analysis of Gold on Thursday 7 October 2021
On Wednesday, gold bottomed out and rebounded due to increase in US indices and US Treasury yields. The US ISM non-manufacturing activity index in September increased to 61.9 from 61.7 in August. Among them, new orders from the service industry rose slightly from 63.2 in August to 63.5, the service industry activity increased beyond expectations. This suggests that US economic activity has improved, supports the Fed's forecast of tightening monetary policy, and puts pressure on gold prices.
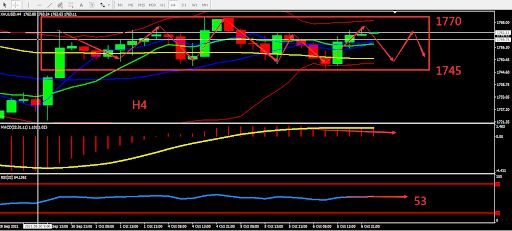
Technically, gold's daily candle closed slightly bullish and continues to be under pressure below BOLL's middle band, indicators are neutral. On the 4-hour chart, the gold candle is flat, moving average converges, RSI reached 53, indicators are neutral but tend to be bullish. As long as the results of the Non-farm Payroll (NFP) data in September have not been released, continue to be cautious. Overall prioritize operations within the fluctuation zone. Consider the support zone and resistance zone, short term intraday trading split the bull bear point around 1748.

Resistance:1765-1770-1778
Support:1756-1745-1735
Market Analysis of Crude Oil on Thursday 7 October 2021
Crude oil fell sharply on Wednesday, and the US EIA crude oil inventory data recorded an increase of 2.345 million barrels, far exceeding market expectations for a decrease of 418,000 barrels. This is a short-term negative for crude oil. The Iranian Petroleum Minister called on the United States and European countries to lift sanctions on Iran to ease the global energy crisis. OPEC+ maintains relatively stable crude oil production, soaring natural gas prices, energy crisis around the world, and the approaching winter boost oil prices.
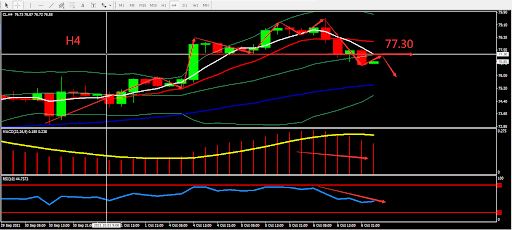
From a technical perspective, the daily line closed bearish without shadow. The short-term bullish sentiment eased but the candle pattern was still bullish. On H4 graph, crude oil broke through the middle BOLL band and the short-term peak appeared. MA formed Death Cross; RSI was at 44.5. Overall, prioritise Sell within the fluctuation zone. The chart below is showing the key point and the estimated trend, the deciding point whether to buy or sell is near 77.30.

Resistance:77.30-78.20-79.50
Support:76.50-76.00-75.20
This material is from Quant Tech Limited and is being posted with permission from Quant Tech Limited. The views expressed in this material are solely those of the author and/or Quant Tech Limited and BTCDana is not endorsing or recommending any investment or trading discussed in the material. Before acting on this material, you should consider whether it is suitable for your circumstances and as necessary, seek professional advice


