Market Analysis of Gold on Wednesday 6 October 2021
On Tuesday, Gold fell after three straight days of gains as the non-manufacturing index released by the US ISM was 61.9, higher than 61.7 in August. The data boosted optimistic expectations for an economic recovery, leading to higher yields on the US dollar and US Treasuries, and gold came under pressure. The strong rebound in US stocks following selling pressure on Monday also weakened demand for gold.
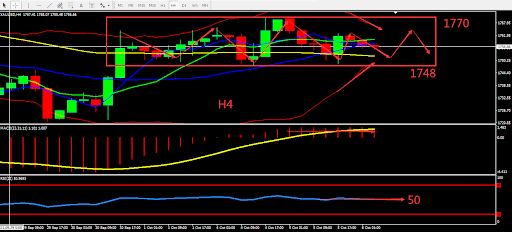
From a technical perspective, the daily gold candle is under pressure by the middle BOLL band, and gold candle is still on a downward trend. MA10 is supported near 1750, and indicators are relatively neutral but weak. On the 4-hour chart, the BOLL band is narrowing suppressing the bull and bear. The MA lines are converging and enter the fluctuation zone before the announcement of important data. Overall prioritize operation within fluctuation zone. Consider the support zone and resistance zone, short term intraday trading split the bull bear point around 1748.

Resistance:1763-1770-1778
Support:1748-1740-1735
Market Analysis of Crude Oil on Wednesday 6 October 2021
On Monday, crude oil was stable at a seven-year high and continued to rise, testing the highest point $79.22 per barrel. Natural gas futures closed 9.5%, the highest closing price in December 2008. The rise in crude oil was boosted by the maintenance plan to increase production. OPEC+ agreed to maintain the current gradual increase in production plan starting from November to increase production by 400,000 barrels per day. Currently, OPEC+ is still implementing 5.8 million barrels of production reduction measures but plans to increase production, gradually withdrawing the production reduction agreement before April 2022.
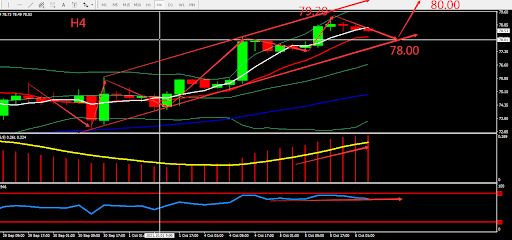
From a technical perspective, the daily graph closed bullish, just one more step to reach $80. The trend shows bullish sign. On H4 graph, MA formed Golden Cross and diverged upward. MACD strengthened. Overall prioritise Buy, level 80 becomes a short-term key point. The chart below is showing the key point and the estimated trend, the deciding point whether to buy or sell is near 78.00.

Resistance:79.20-80.00-82.00
Support:78.00-77.20-76.00
This material is from Quant Tech Limited and is being posted with permission from Quant Tech Limited. The views expressed in this material are solely those of the author and/or Quant Tech Limited and BTCDana is not endorsing or recommending any investment or trading discussed in the material. Before acting on this material, you should consider whether it is suitable for your circumstances and as necessary, seek professional advice.


