Market Analysis of Gold on Tuesday 5 October 2021
On Monday, the US dollar fell to a low of 93.67. US stocks experienced a strong sell-off, with the Nasdaq down 2.5%, supporting gold to gain more than $30, and hit the $1770 mark in the short term. Brad the Fed, who is a supporter of hawkish stance, emphasized that the risk of high inflation was the cause of the soaring gold price yesterday. Of course, the underlying reason is a crisis of market confidence in the US government. Accelerating growth in factory orders and expectations that the Federal Reserve will reduce debt purchases have limited gold price growth.
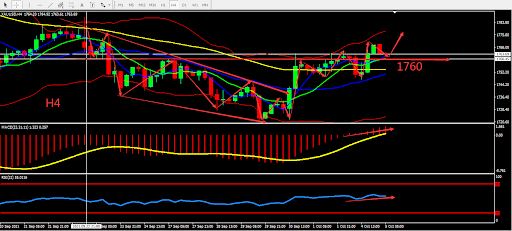
Technically, the gold candle forms a hammer pattern with no upper shadow. Gold is trying to strengthen but faces resistance around the middle BOLL band. On the 4-hour chart, gold candle rose rapidly after breaking through the middle BOLL band, MA formed a golden cross. Pay attention to MACD around the 0 axis. Overall, prioritise buy on low prices in the fluctuation zone. Consider the support zone and resistance zone, short term intraday trading split the bull bear point around 1760.

Resistance:1770-1778-1788
Support:1760-1750-1738
Market Analysis of Crude Oil on Tuesday 5 October 2021
On Tuesday Asia session, crude oil fluctuated around 77,59 and touched 78,19 on Monday, the highest level in 2014, because the shortage of natural gas stimulated greater demand for oil. With high natural gas prices, crude oil has become a cheap alternative to power generation. Previously, OPEC+ confirmed that it will adhere to the current production policy. Due to the rebound in demand, some countries demanded to increase production. However, some OPEC+ members have limited capacity to increase production, and the oil industry is facing the dilemma of insufficient investment.
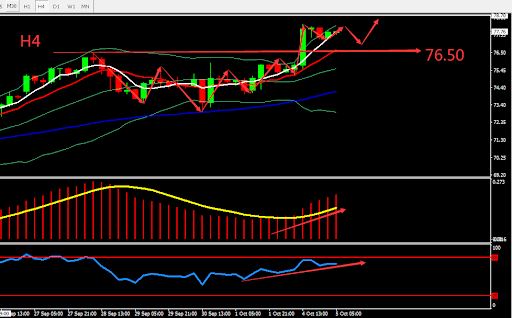
From a technical perspective, the daily graph closed bullish, breaking through the previous high of 76,50. The indicators showed bullish sign. On H4 graph, MA formed Golden Cross. The head and shoulder pattern has completed. Indicator continues to show bullish sign. Overall, if there is a breakthrough, prioritise Buy. The chart below is showing the key point and the estimated trend, the deciding point whether to buy or sell is near 76.50.

Resistance:78.20-79.00-80.00
Support:77.20-76.50-75.00
This material is from Quant Tech Limited and is being posted with permission from Quant Tech Limited. The views expressed in this material are solely those of the author and/or Quant Tech Limited and BTCDana is not endorsing or recommending any investment or trading discussed in the material. Before acting on this material, you should consider whether it is suitable for your circumstances and as necessary, seek professional advice.


