Market Analysis of Gold on Monday 4 October 2021
On Monday, gold continued its strengthening since last week, supported by inflation data from the United States and Europe. German import prices hit their fastest rate of increase in 40 years in September. Eurozone inflation data hit a 13-year high in September, and inflation in the US remained at a 30-year high in August. The US debt ceiling crisis prompted strong risk aversion sentiment, helping the precious metal resist the effect from US dollar and US bond yields. It also raises expectations that interest rate hikes and debt reductions will occur ahead of schedule. Focus on non-farm employment (NFP) data this week.
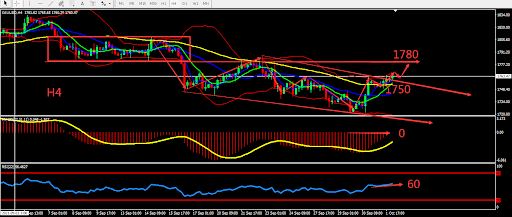
Technically, gold's daily candle continuously closed bullish and is steady above the MA5 and MA10. The RSI is approaching 50. On the 4-hour chart, the gold candle is steady, breaking through the recent downtrend line, MACD is at around the 0 axis, and the RSI is entering a stronger zone. Overall prioritize buying at low prices in the fluctuation zone. Consider the support zone and resistance zone, short term intraday trading split the bull bear point around 1750.

Support:1768-1777-1788
Resistance:1757-1750-1742
Market Analysis of Crude Oil on Monday 4 October 2021
On Monday, crude oil kept fluctuating on high position during the market opening. The recent surge in natural gas prices has prompted power companies to switch from natural gas to petroleum products and consider using fuel oil or diesel for power generation, pushing up oil prices. Power plants in Pakistan, Bangladesh and many countries in the Middle East have begun to replace fuel. Recovery demand is expected to increase refinery profits and create more room for recovery or new production.
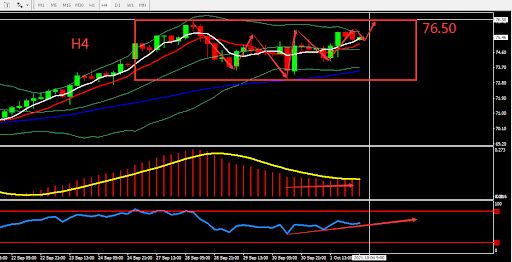
From a technical perspective, crude oil has risen by nearly $15 from 61.7 to 76.5. The weekly graph approached the resistance of upper BOLL Band. The daily graph strengthened, and indicators showed bullish sign. On H4 graph, the graph was stable above the middle BOLL band and supported by MA60. Overall, crude oil is fluctuating on high position. Prioritise Sell on high position and Buy on low position. The chart below is showing the key point and the estimated trend, the deciding point whether to buy or sell is near 76.50.

Resistance:76.00-76.50-78.00
Support:75.00-74.00-73.00
This material is from Quant Tech Limited and is being posted with permission from Quant Tech Limited. The views expressed in this material are solely those of the author and/or Quant Tech Limited and BTCDana is not endorsing or recommending any investment or trading discussed in the material. Before acting on this material, you should consider whether it is suitable for your circumstances and as necessary, seek professional advice.


