Market Analysis of Gold on Wednesday 29 September 2021
On Wednesday's Asian session, gold was steady at around 1740. On Tuesday, gold prices fell more than 1% to their lowest in seven weeks as the US dollar and US Treasuries yields rose due to early interest rate hikes. However, consumer confidence continued to decline, and the stock market corrected sharply. Among these, the Dow Jones index fell 560 points and the Nasdaq fell 2.8%. This limits the decline in gold prices. The Fed's use of the reverse repurchase program overnight hit a record high of $1.365 trillion. For today, pay attention to speeches by Fed Chair Powell and other officials as well as the Japanese prime minister's election.
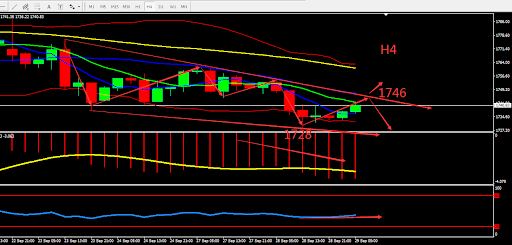
From a technical perspective, the daily gold candle continues to close bearish, Gold’s candle indicates the formation of a ladder down, and indicators weaken overall. On the 4-hour chart, gold's downward channel broke its recent low and tested 1728, MACD volume decreased and MA formed a Death Cross. Overall prioritize Selling at high prices in the fluctuation zone. Consider the support zone and resistance zone, short term intraday trading split the bull bear point around 1746.

Resistance:1746-1753-1760
Support:1734-1728-1720
Market analysis of Crude Oil on Wednesday 29 September 2021
On Tuesday, the plunge in the US stock market causes oil prices hit a high since July of US$76.50 per barrel and then fell 1.4%. The current structural increase in crude oil is defined as driven by fundamental imbalances and financial bubbles, caused by Hurricane Ida. The loss of oil production in the United States is about 30 million barrels, and it is also one of the main reasons why the Organization of Petroleum Exporting Countries and its allies (OPEC+) have failed to change the world's supply situation since July this year.
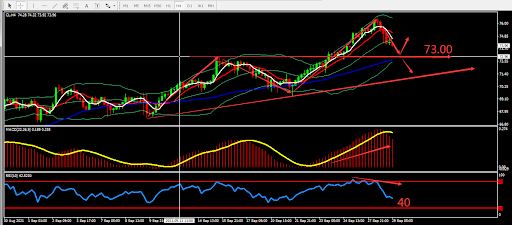
From a technical perspective, the daily graph closed by hammer pattern, hitting a new high and fell back. There was a peak signal in the short-term. Some indicators show probability of bearish signal. On H4 graph, crude oil turned downward from a high position, breaking through the middle BOLL band. MA formed Death Cross on high position. RSI weakened and moved under level 50. Overall, prioritise Sell within the fluctuation zone. The chart below is showing the key point and the estimated trend, the deciding point whether to buy or sell is near 73.00.

Resistance:74.70-75.50-76.50
Support:73.50-73.00-71.50
This material is from Quant Tech Limited and is being posted with permission from Quant Tech Limited. The views expressed in this material are solely those of the author and/or Quant Tech Limited and BTCDana is not endorsing or recommending any investment or trading discussed in the material. Before acting on this material, you should consider whether it is suitable for your circumstances and as necessary, seek professional advice.


