Market Analysis of Gold on Tuesday 28 September 2021
On Monday, US dollar continued to strengthen, as the US 10-year Treasury yield increased, hitting a new high in the last three months and breaking through the 1.50% mark. Gold skyrocketed and then weakened, with a brief increase of $ 10 in the intraday trading session, but by the end of the market, gold spewed all of its increase of the day. The number of new orders and shipments of Caixin goods in the United States continued to increase in August. Core capital goods orders increased 0.5% from the previous month due to strong demand for electronic products. Speeches by US Fed officials this week may confirm forecasts that asset purchase plans will begin to scale down before the end of the year.
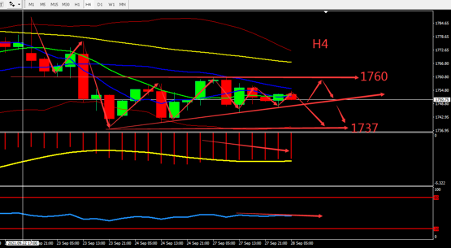
Technically, gold's daily candle closed with a Doji pattern, rebounded but met with resistance, and formed a clear downward trend. The indicator shows bearish signals. The 4 hours chart shows that the gold market is sideways, the BOLL is flat, MACD continues to operate below the 0 axis. Overall prioritize selling at high prices in the fluctuation zone. Consider the support zone and resistance zone, short term intraday trading split the bull bear point around 1760.

Resistance:1760-1767-1776
Support:1744-1737-1728
Market Analysis of Crude Oil on Tuesday 28 September 2021
Crude oil rose by $1.05 on Monday and closed at $75.26 per barrel, the highest level since July 7. This is because the spread of the new variant of delta virus eased, fuel demand quickly recovered, and Hurricane Ida severely damaged US crude oil production. At the same time, the global energy crisis will rapidly tighten the crude oil market supply and continue to increase oil prices.
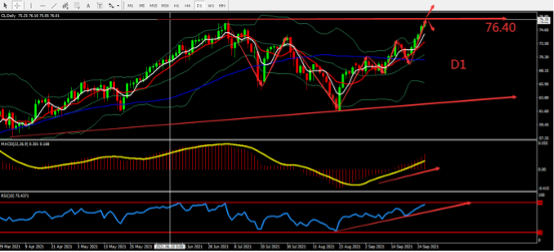
From a technical perspective, crude oil continued to break new high and fluctuates upwards on Monday. The daily candle was closed by 5 consecutive bullish candles and the bullish sentiment was strong. The indicators showed bullish sign. On H4 graph, the market was bullish. MA formed Golden Cross at low position and formed bullish divergence. MACD strengthened, BOLL opened upward. Overall, prioritise Buy within the fluctuation zone. Pay attention to the previous high point of 76.40 from the previous period. The chart below is showing the key point and the estimated trend, the deciding point whether to buy or sell is near 76.40.

Resistance:76.40-77.00-78.00
Support:75.60-75.00-74.20
This material is from Quant Tech Limited and is being posted with permission from Quant Tech Limited. The views expressed in this material are solely those of the author and/or Quant Tech Limited and BTCDana is not endorsing or recommending any investment or trading discussed in the material. Before acting on this material, you should consider whether it is suitable for your circumstances and as necessary, seek professional advice.


