Market Analysis of Gold on Friday 24 September 2021
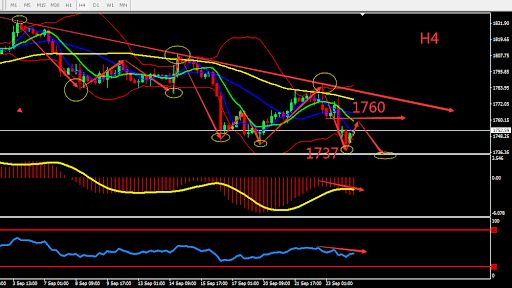
On Thursday evening, the US dollar fell below 93, and gold declined rapidly below 1750 to 1737.79, with a drop of nearly $40. US stock prices rose, US Treasury fell, prompting the 30-year US Treasury bond yield to rise by 2.6 basis points, recovering from Wednesday's decline. This indicates that market risk sentiment continues to heat up after the Fed's decision. Part of the other reason may be the news about China's Evergrande stimulus. With the advent of riskier assets such as US stocks, safe-haven assets such as the US dollar and gold have seen a sharp sell-off.
From a technical perspective, gold continues to decline, and yesterday's daily candle closed bearish, forming a downward trend. The indicator is relatively bearish. On the 4 hours chart gold continues to hit new lows, the market's bearish sentiment is heavy, and all indicators are showing bearish signals. Overall, prioritize operation in the fluctuation zone. Consider the support zone and resistance zone, short term intraday trading split the bull bear point around 1760

Resistance:1760-1767-1776
Support:1745-1737-1730
Market Analysis of Crude Oil on Friday 24 September 2021
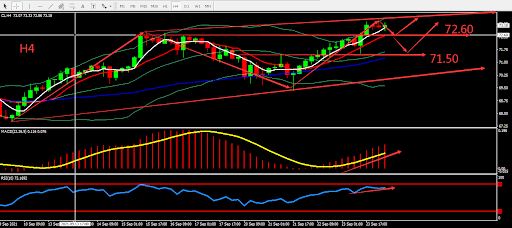
Crude oil rose by 1.28 USD on Thursday, or 1.7%, to close at 73.13 USD per barrel. As production in the Gulf of Mexico was still halted after the two hurricanes, U.S. crude oil inventories was at its lowest level since 2018. At the same time, fuel demand grew. The supply from a major hub in Europe was still below the average level in a year. Supply and demand in the energy market causes continuous imbalances which provides support for the upward trend of oil prices.
From a technical perspective, crude oilcontinued to be closed by bullish candle and hit a new short-term high. The trend was supported by MA5 and formed Golden Cross. MACD volume strengthened, overall indicators showed bullish sign. On H4 graph, the graph went upward and formed upper ladder, the indicators showed bullish sign. Overall, the rebound of crude oil is a good chance to open Buy position. The chart below is showing the key point and the estimated trend, the deciding point whether to buy or sell is near 72.60.

Resistance:73.50-74.00-75.00
Support:72.60-72.00-71.50
This material is from Quant Tech Limited and is being posted with permission from Quant Tech Limited. The views expressed in this material are solely those of the author and/or Quant Tech Limited and BTCDana is not endorsing or recommending any investment or trading discussed in the material. Before acting on this material, you should consider whether it is suitable for your circumstances and as necessary, seek professional advice.


