Market Analysis of Gold on Thursday 23 September 2021
On Wednesday, the news led the gold market. Gold prices plunged more than 20 dollars; the dollar index rebounded sharply after briefly breaking through 93. The Federal Open Market Committee (FOMC) announced that it will keep the target range for the federal funds rate unchanged at 0-0.25% and will continue to buy bonds amounting USD 120 billion each month until it moves toward the committee's goals of employment and price stability. The US Fed may start scaling back its asset purchases in early November and finish in mid-2022.
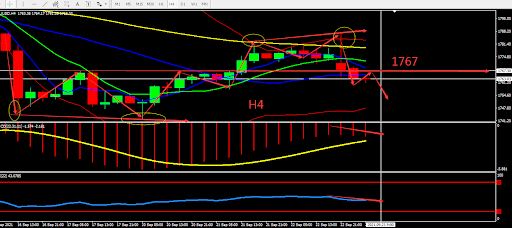
From a technical perspective, gold's daily candle is under pressure, forming a hammer pattern, and the indicators are relatively bearish. On the 4-hour chart, gold candles are parallel indicating that the market is still losing direction. The indicator is relatively bearish. Overall, prioritize operation in the fluctuation zone. Consider the support zone and resistance zone, short term intraday trading split the bull bear point around 1767.

Resistance:1767-1776-1787
Support:1758-1750-1742
Market Analysis of Crude Oil on Thursday 23 September 2021
On Wednesday, crude oil rose by 1.14 USD and closed at 71.91 USD per barrel. EIA data shows that as of the week of September 17, crude oil inventories fell by 3.481 million barrels to 414 million barrels, the lowest since October 2018. The continuous decline in inventories aggravated supply concerns and provided support for crude oil prices. Due to tight supply and insufficient reserves, the price of natural gas has soared, forcing European governments to make plans to provide emergency assistance to households and public utilities, which also benefits the energy sector.
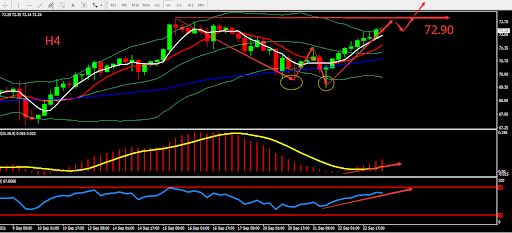
Technically, the daily crude oil candle was supported by middle BOLL band and closed bullish, the indicators also showed bullish sign. On H4 graph, there was a correction. Crude oil formed double bottom and MA formed Golden Cross. MACD volume strengthened, RSI showed bullish sign. Overall, prioritise Buy within the fluctuation zone. The chart below is showing the key point and the estimated trend, the deciding point whether to buy or sell is near 72.90.

Resistance:72.90-73.50-74.00
Support:71.70-71.00-70.10
This material is from Quant Tech Limited and is being posted with permission from Quant Tech Limited. The views expressed in this material are solely those of the author and/or Quant Tech Limited and BTCDana is not endorsing or recommending any investment or trading discussed in the material. Before acting on this material, you should consider whether it is suitable for your circumstances and as necessary, seek professional advice.


