Market Analysis of Gold on Wednesday 22 September 2021
On Tuesday in US trading markets, global markets stabilized after a sell-off in the three major US stock indexes. All three US stock index fluctuated and rose while the US dollar index fell due to reduced safe-haven demand. With the fall in the value of the US dollar, and the Evergrande debt crisis, spot gold continued to rise, and briefly surpassed US$1780/ounce. The Fed's two-day FOMC monetary policy meeting opens, and markets will be watching the policy statement at the press conference from Powell.
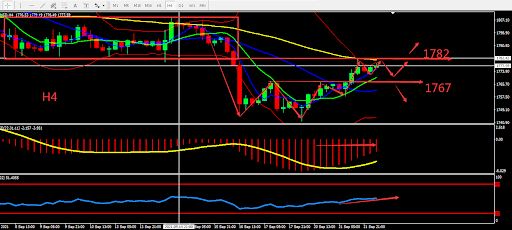
From a technical perspective, gold's daily candle closed bullish, and has been operating below the middle BOLL band for a long time. The RSI indicator has signs of stabilisation at the level of 50. H4 chart shows correction after a sharp decline. MA forms golden cross, MACD volume is likely to weaken and other indicators remain relatively bullish. Overall, prioritize operation in the fluctuation zone. Consider the support zone and resistance zone, short term intraday trading split the bull bear point around 1782

Resistance:1782-1790-1800
Support:1767-1758-1750
Market Analysis of Crude Oil on Wednesday 22 September 2021
On Wednesday in early trading, API data showed that crude oil inventories fell by 6.108 million barrels for the week, far exceeding the expected value of 2.4 million barrels. The short-term oil price is currently at around 71.20. Market concerns about the outlook for global consumption have alleviated the impact of OPEC’s major oil-producing countries’ difficulty in providing sufficient supplies to meet growing demand. The International Energy Agency called on Russia to send more natural gas to Europe to help the region alleviate the energy crisis.
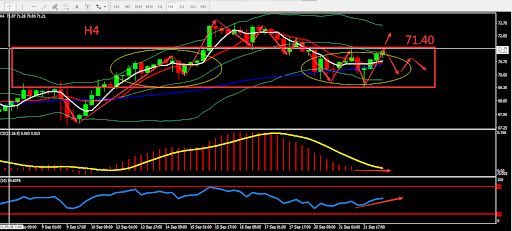
From a technical perspective, the daily graph closed by Doji Star. Crude oil has operated above the middle BOLL band for a long time and remained strong. MACD moved above the 0 axis. On H4 graph, crude oil rebounded after reaching the lower BOLL band. The indicators lacked direction and showed mixed bullish and bearish sign. Overall, prioritise operation within the fluctuation zone. Pay attention to EIA data when trading at night. The chart below is showing the key point and the estimated trend, the deciding point whether to buy or sell is near 71.40.

Resistance:71.40-72.00-72.90
Support:70.70-70.00-69.30
This material is from Quant Tech Limited and is being posted with permission from Quant Tech Limited. The views expressed in this material are solely those of the author and/or Quant Tech Limited and BTCDana is not endorsing or recommending any investment or trading discussed in the material. Before acting on this material, you should consider whether it is suitable for your circumstances and as necessary, seek professional advice.


