Market Analysis of Gold on Tuesday 21 September 2021
On Monday, Gold rebounded quickly after hitting its lowest level in more than five weeks and is currently trading at around $1,763 an ounce. As global stock markets have been hit hard, cryptocurrencies have been under resistance, and the US debt ceiling has matured, risk aversion sentiment by buying gold has increased. Policy decision at the Fed meeting on Wednesday will be the focal point of attention for the market. The Fed may release a signal that it insists on starting to scale back its bond buying within this year. But facing the current uncertainty, the Fed will also link any actual policy changes to US job growth in September and beyond.
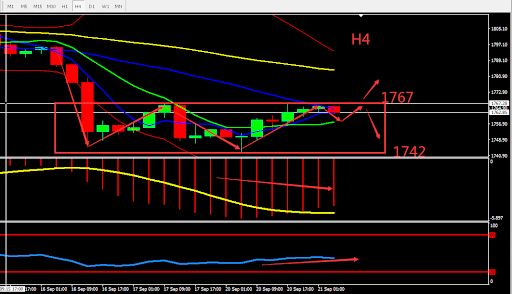
From a technical perspective, the gold daily candle closes with a large bullish candle. However, it has not broken the recent resistance around 1767, and indicators are bearish. On the 4-hour chart, the gold candle maintains operation within the interval and there has been no effective breakout. The MA lines are converging, the MACD indicator volume is strengthening and the RSI indicator is showing a bullish signal. Overall, prioritize operation in the fluctuation zone. Consider the support zone and resistance zone, short term intraday trading split the bull bear point around 1767

Resistance:1767-1773-1780
Support:1757-1750-1742
Market Analysis of Gold on Tuesday 21 September 2021
On Monday, due to rising risk aversion, the stock market crashed, the US dollar strengthened, and oil prices fell nearly 2%. Shell said that after Hurricane Ida caused major damage, the company’s U.S. Gulf of Mexico oil fields will not recover until next year. The Gulf of Mexico region contributes about 16% of U.S. oil production, or 1.8 million barrels per day. OPEC and its allies are working hard to keep oil prices at $70 per barrel in the first quarter of 2022, and the supply tightening constitutes a certain support for oil prices
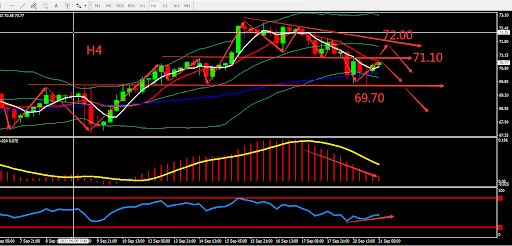
Technically, the daily graph continuously closed bearish, the candle shrank to near the middle BOLL band, and the main indicators were relatively strong. On H4 graph, the oil price moved to around the lower BOLL band and formed Doji Bottom. MACD volume weakened. Overall, prioritise Sell within the fluctuation zone. The chart below is showing the key point and the estimated trend, the deciding point whether to buy or sell is near 69.70.

Resistance:71.10-72.00-72.90
Support:70.20-69.70-68.20
This material is from Quant Tech Limited and is being posted with permission from Quant Tech Limited. The views expressed in this material are solely those of the author and/or Quant Tech Limited and BTCDana is not endorsing or recommending any investment or trading discussed in the material. Before acting on this material, you should consider whether it is suitable for your circumstances and as necessary, seek professional advice.


