Bitcoin fell rapidly short-term on the early trading on Monday, reaching the lowest point $45,126 and is currently at $45,700 or an intraday drop of more than 4%. The total market value of cryptocurrencies exceeded $2.23 trillion. The market value of Bitcoin accounted for 40.5%, the computing power was 140.49 EH/s, and the market value was close to a record high of $395.7 billion. The total number of Bitcoin ATM installations worldwide has reached 27,670. According to the Cambridge Bitcoin Electricity Consumption Index, Bitcoin will consume approximately 95.68 TWh (one trillion watts per hour) by this year.
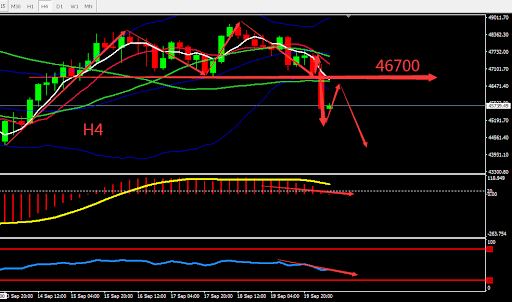
From a technical perspective, Bitcoin’s weekly candle undergo correction after a sharp drop at 7th September. However Bitcoin failed to stabilise at around $50,000 and is currently sideways. H4 graph shows that Bitcoin’s candle broke through the middle BOLL band and formed an M pattern. $46.700 is the neck of the M pattern, and indicators are bearish. Overall prioritise Sell on High on the fluctuation zone. The chart below is showing the key point and the estimated trend, the deciding point whether to buy or sell is near 46,700.

Resistance:46700-47800-48800
Support:45100-44100-43300
This material is from Quant Tech Limited and is being posted with permission from Quant Tech Limited. The views expressed in this material are solely those of the author and/or Quant Tech Limited and BTCDana is not endorsing or recommending any investment or trading discussed in the material. Before acting on this material, you should consider whether it is suitable for your circumstances and as necessary, seek professional advice.


