Market Analysis of Gold on Friday 17 September 2021
On Thursday, US retail sales in August increased by 0.7%. The data recorded a decline of 1.8% in July while the forecast was for a decline of 0.8%. This data caused the dollar to rise sharply, and the price of gold had fallen by more than $50. Rising US Treasury yields are also putting pressure on gold prices! The yield on the 10-year US Treasury bond rose 4.4 basis points to 1.348%, returning to levels before the CPI report was released on Tuesday. The outlook for the US economy changed before the Fed's interest rate announcement, and market uncertainty increased.
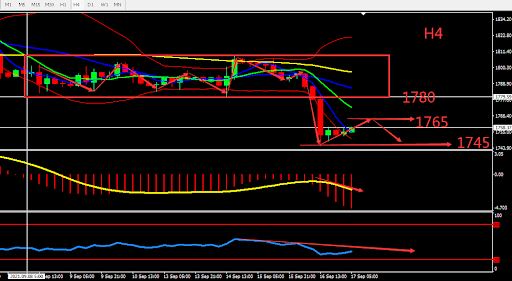
Technically, gold's daily graph closed with a large bearish candle. The correction at the start of the market was limited, and there are signs that the stability of the market is starting to falter. MA forms a Death Cross and the indicator tends to be bearish. The 4 hours chart shows that gold is rapidly weakening after breaking through $1780, MACD volume is declining and all indicators are showing bearish signals. Overall, prioritize operation in the fluctuation zone. Consider the support zone and resistance zone, short term intraday trading split the bull bear point around 1765

Resistance:1765-1773-1780
Support:1750-1745-1730
Market Analysis of Crude Oil on Friday 17 September 2021
On Friday Asia session, crude oil fluctuated around 72.20. Due to the mixed effects of US economic data and the fading of the threat of Hurricane Nicholas to crude oil production in the US Gulf of Mexico, low gas inventories and lower than normal Russian supplies, European energy prices soared. The possibility of rising international oil prices in the second half of the year continues to increase, especially as this winter is much colder than normal, the global average daily demand for crude oil may increase by 1 million barrels to 2 million barrels, pushing up oil prices.
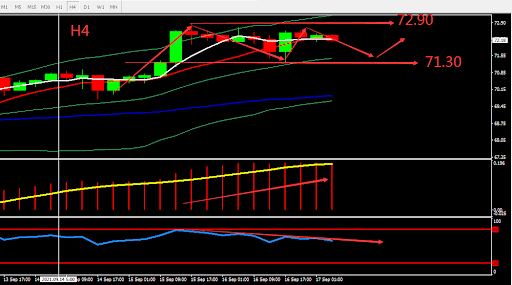
Technically, the daily candle strengthened and formed Upper Ladder. MA kept diverging upward. On H4 graph, BOLL fluctuated upwards, MACD volume strengthened but RSI had some bearish signs. Overall, prioritise Buy within the fluctuation zone. The chart below is showing the key point and the estimated trend, the deciding point whether to buy or sell is near 71.30.

Resistance:72.60-73.00-73.80
Support:71.70-71.30-70.50
This material is from Quant Tech Limited and is being posted with permission from Quant Tech Limited. The views expressed in this material are solely those of the author and/or Quant Tech Limited and BTCDana is not endorsing or recommending any investment or trading discussed in the material. Before acting on this material, you should consider whether it is suitable for your circumstances and as necessary, seek professional advice.


