Market Analysis of Gold on Thursday 16 September 2021
On Wednesday the price of Gold fell, and gold failed to maintain the price of $1800. Data showed that the September New York Fed manufacturing index was 34.3, which was higher than August. The US monthly import price index fell 0.3% in August, the lowest record since April last year, while the forecast figure was an increase of 0.3%, and the previous value was an increase of 0.3%. The inflation which has slowed down has caused a change in market condition, so the Fed can take a gradual approach to normalizing policy and reducing the scale of debt purchases. The focus shifts to the Fed's 2-day monetary policy meeting next week.
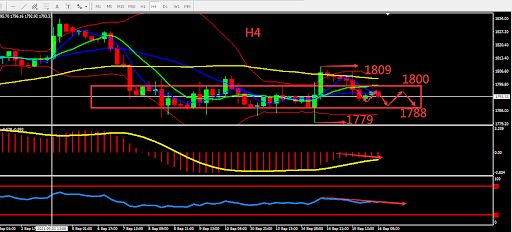
From a technical perspective, the stimulus from short-term data failed to change the sideways market conditions around 1800. The 4 hours chart shows the BOLL is flat, MA is forms Death Cross and MACD is moving down. Overall, prioritize operation in the fluctuation zone. Consider the support zone and resistance zone, short term intraday trading split the bull bear point around 1800.

Resistance:1800-1809-1818
Support:1788-1779-1770
Market Analysis of Crude Oil on Thursday 16 September 2021
On Wednesday Europe session, oil price skyrocketed, reaching the highest $72.87 per barrel. In the week of September 10, the United States records a drop in EIA crude oil inventories by 6.422 million barrels, the expected value is a decrease of 3.574 million barrels, and the previous value is a decrease of 1.528 million barrels. With the expansion of the scope of vaccination, the recovery of oil demand was supported. Report said: The supply losses caused by the US Gulf storm offset the increase in supply vy OPEC and its allies, and the global crude oil market will have to wait until October to obtain more oil.
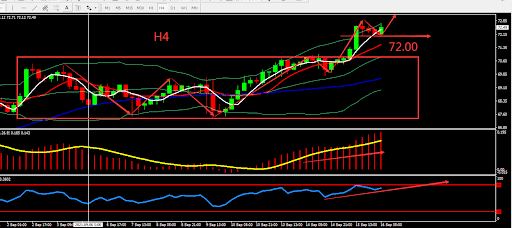
From a technical perspective, the daily candle closed bullish. MA formed Golden Cross, RSI strengthened, and overall trend was bullish. Focus on the resistance at level 74. On H4 graph, BOLL moved upward, and MA diverged. MACD volume strengthened. Overall, prioritise Buy within the fluctuation zone. The chart below is showing the key point and the estimated trend, the deciding point whether to buy or sell is near 72.00.

Resistance:71.20-71.70-72.30
Support:72.00-71.30-70.50
This material is from Quant Tech Limited and is being posted with permission from Quant Tech Limited. The views expressed in this material are solely those of the author and/or Quant Tech Limited and BTCDana is not endorsing or recommending any investment or trading discussed in the material. Before acting on this material, you should consider whether it is suitable for your circumstances and as necessary, seek professional advice.


