Market Analysis of Gold on Wednesday 15 September 2021
Influenced by the news on Tuesday, US indexes fell under pressure and hit a low of 92.33, while gold rose sharply by $28 to $1808.63 an ounce. US stocks opened high and then fell. The Dow Jones index had fallen more than 180 points, or 0.5%. According to a report from the US Department of Labor, the US CPI in August increased at an annual rate of 5.2%, and the annual core CPI increased by 4.0%, both lower than expected and the previous value. This indicates that the pressure from rising inflation is starting to weaken, which gives the Fed reason to delay the announcement of reducing the scale of bond purchases.
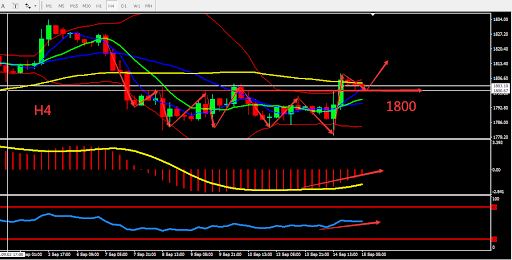
From a technical perspective, gold's daily candle closed bullish and stabilise at around 1800, indicators are neutral. On the 4-hour chart, the gold candle is stable on the middle Bollinger band. The MA forms Golden Cross and the indicators are relatively strong. Overall prioritize buying at low prices in the fluctuation zone. Consider the support zone and resistance zone, short term intraday trading split the bull bear point around 1800.

Resistance:1809-1818-1828
Support:1800-1792-1780
Market Analysis of Crude Oil on Wednesday 15 September 2021
On Wednesday Asia session, crude oil fluctuated around 70.70. API data released in the morning showed that US crude oil inventories fell by 5.437 million barrels, gasoline inventories fell by 2.8 million barrels, and distillate inventories fell by 2.9 million barrels. Although tropical storm "Nicholas" brought torrential rains and blackouts to Texas, it caused less damage to the US energy infrastructure than Hurricane Ida earlier this month, and market concerns about possible threats to the supply of crude oil in the Gulf of Mexico faded. Oil prices are relatively stable.
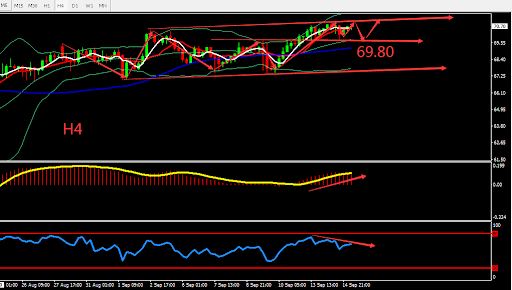
From a technical perspective, the daily graph closed by three consecutive bullish candles. Yesterday, crude oil closed by doji star and show certain signs of resistance, and RSI were bullish. H4 graph shows formation of upward channel, MA5 dand MA10 converges and there were signs of correction. Indicators showed bullish sign. Overall, prioritise Buy within the fluctuation zone. The chart below is showing the key point and the estimated trend, the deciding point whether to buy or sell is near 69.80.

Resistance:71.20-71.70-72.30
Support:70.30-69.80-69.10
This material is from Quant Tech Limited and is being posted with permission from Quant Tech Limited. The views expressed in this material are solely those of the author and/or Quant Tech Limited and BTCDana is not endorsing or recommending any investment or trading discussed in the material. Before acting on this material, you should consider whether it is suitable for your circumstances and as necessary, seek professional advice.


